IMAGE

Figure 2

ID
ZDB-IMAGE-211201-31
Source
Figures for López-Pérez et al., 2021
Image
Figure Caption

Figure 2

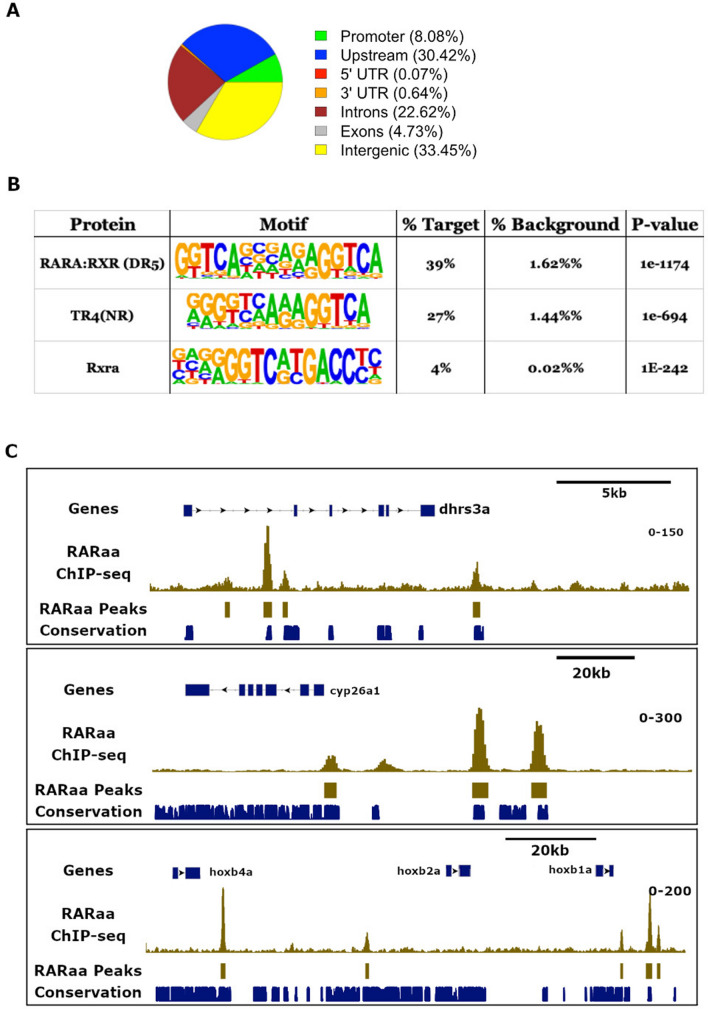
Identification of RAR binding sites in the zebrafish endoderm. (A) Distribution of ChIP-seq peaks to the different regions of the zebrafish genome. (B) Top 3 motifs overrepresented in all ChIP-seq peak sequences with the percentage of sites containing the motifs and the p-value of enrichment. The three motifs consist to a repetition of the A/GGGTCA sequence; the first corresponds to the classical DR5 recognized by the RARA:RXR complex, the second (TR4) is a superposition of DR1 and DR2, and the third is a IR0. (C) Visualization of RARaa binding sites around the dhrs3a gene (upper panel), cyp26a1 (middle panel) and hoxb1a-hoxb4a genomic region (below panel). Tracks in gold correspond to RARaa ChIP-seq reads and identified RARaa peaks. The track in blue shows the location of conserved genomic sequences (from the UCSC Genome Browser obtained from comparison of 5 fish species).

Acknowledgments
This image is the copyrighted work of the attributed author or publisher, and ZFIN has permission only to display this image to its users. Additional permissions should be obtained from the applicable author or publisher of the image. Full text @ Sci. Rep.