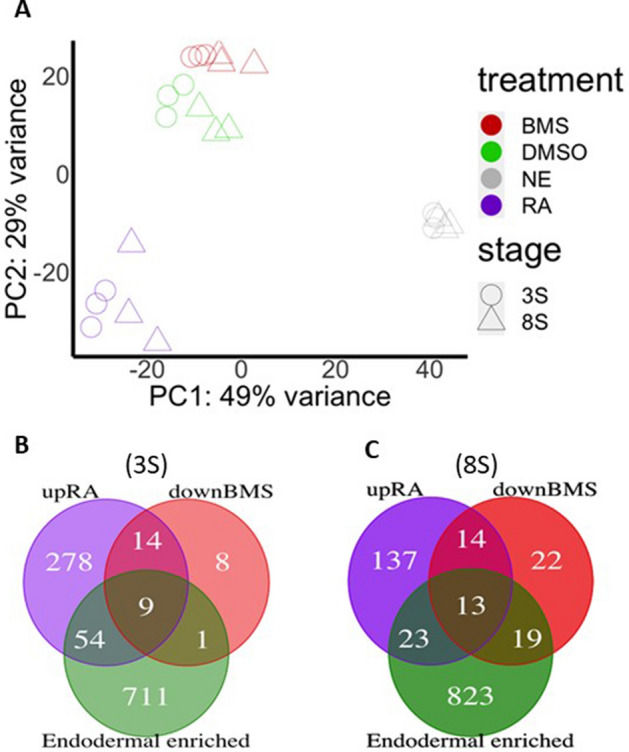
Effect of RA and BMS493 on the transcriptome of endodermal cells. (A) Principle component analysis (PCA) of the 24 RNA-seq data obtained on cells isolated at 3-somites stage (circle) and 8-somites stage (triangle). The colors indicate the data for non-endodermal cells (NE) (grey), and endodermal cells treated with RA (purple), BMS493 (red) and DMSO as control (green). The plot shows high reproducibility between triplicates. The strongest transcriptomic differences occur between endodermal and non-endodermal cell (along PC1), then between endodermal cells treated with RA and DMSO (along PC2), while BMS493 treatment has minimal influences. Consistent with the inverse-agonist action of BMS493 and with the agonist action of RA, these samples are located far from each other, the DMSO-samples being located between them. (B,C) Venn diagram displaying the number of genes up-regulated by RA (purple), down-regulated by BMS493 (red) and endodermal enriched (green) at 3-somites (B) and 8-somites stage (C).
Acknowledgments
This image is the copyrighted work of the attributed author or publisher, and
ZFIN has permission only to display this image to its users.
Additional permissions should be obtained from the applicable author or publisher of the image.
Full text @ Sci. Rep.
Your Input Welcome
Thank you for submitting comments. Your input has been emailed to ZFIN curators who may contact you if
additional information is required.
Oops. Something went wrong. Please try again later.