IMAGE

Figure 6

ID
ZDB-IMAGE-211201-38
Source
Figures for López-Pérez et al., 2021
Image
Figure Caption

Figure 6

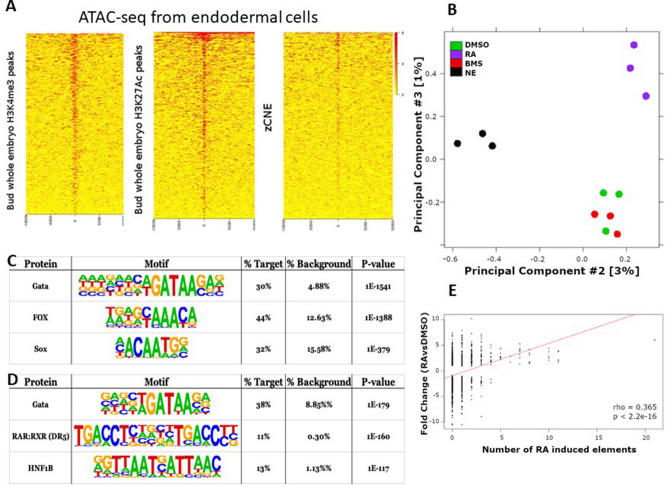
Identification of nucleosome-free regions in zebrafish endodermal cells and following RA treatments by ATAC-seq assays. (A) Heat maps showing enrichment of ATAC-seq reads at the middle of chromatin regions harbouring H3K4me3 and H3K27Ac epigenetic marks and at genomic areas corresponding to zCNE. The maps display intervals flanking 10 kb up and downstream of the features. The heat map plots shown on this figure corresponds to the ATAC-seq data obtained with control endodermal cells (DMSO-treated). Similar results were obtained for the other samples (see Suppl. Fig. 4). (B) PCA plots obtained for the ATAC-seq libraries. ATAC-seq data from endodermal and non-endodermal cells are separated along the PC2 axis, while those from RA-treated versus control and BMS493 are separated along the PC3 axis. The plot shows clustering of triplicates and no obvious separation of the DMSO- and BMS493- treated cells. (C,D) Top 3 enriched motifs found in nucleosome-free regions detected specifically in endoderm (C) and detected following RA-treatments (D). (E) Plot showing the correlation of RA-induced gene expression (log2 fold change) and the number of RA-induced nucleosome-free elements located nearby the genes. Only genes showing significant RA gene induction were included.

Acknowledgments
This image is the copyrighted work of the attributed author or publisher, and ZFIN has permission only to display this image to its users. Additional permissions should be obtained from the applicable author or publisher of the image. Full text @ Sci. Rep.