
- Title
-
Marine Bromophenol Bis(2,3,6-Tribromo-4,5-Dihydroxybenzyl)ether Inhibits Angiogenesis in Human Umbilical Vein Endothelial Cells and Reduces Vasculogenic Mimicry in Human Lung Cancer A549 Cells
- Authors
- Dong, S., Chen, Z., Wang, L., Liu, Y., Stagos, D., Lin, X., Liu, M.
- Source
- Full text @ Mar. Drugs

Bis(2,3,6-tribromo-4,5-dihydroxybenzyl)ether (BTDE) inhibits the migration and invasion of HUVECs. (a) Chemical structure of BTDE. (b) HUVECs was incubated in absence or presence of certain concentrations of BTDE at 37 °C for 36 h, cell viability was determined by MTT assay. (c) Wound healing of HUVECs after 36 h treatment with BTDE was reported by inverted microscope (original magnification, 4×; scale bar: 600 μm) and the wound-healing area was measured by Image J software. Migration (d) and invasion (e) abilities of HUVECs were examined by transwell assay. Photos of HUVECs traveled through membrane after incubation with BTDE for 24 h were recorded by inverted microscope (original magnification, 10×; scale bar: 300 μm) and OD values at 570 nm were measured. Data are represented as mean ± SD of three independent experiments. * p < 0.05, ** p < 0.01 versus control. |

BTDE reduces HUVECs tube formation and MMP9 activity. (a) HUVECs was pretreated with BTDE for 24 h, then seeded on matrigel for 20 h, capillary-like structures of HUVECs were recorded by inverted microscope (original magnification, 4×; scale bar: 600 μm) and total length of tubes was measured by Image J software. (b) Different concentrations of BTDE were added after tubes have established on matrigel for 8 h, and incubated for another 6 h. Tubular structures were observed by inverted microscope (original magnification, 4×; scale bar: 600 μm) and total length of tubes compared with 0 μM was measured by Image J software. (c) Gelatin zymography experiment was used to detect the MMP9 activity of HUVECs after 24 h treatment of BTDE, GAPDH was used as an internal control. (d) Western blot was used to measure the VEGF, HIF-1α, β-catenin, AKT, and ERK as well as their phosphorylation levels in HUVECs treated with BTDE for 24 h. Data represent mean ± SD of three independent experiments. * p < 0.05, ** p < 0.01 versus control. |
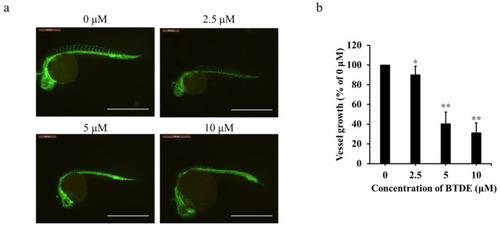
BTDE blocks intersegmental vessel formation in zebrafish embryos. (a) Lateral view of Tg (flk1: EGFP) zebrafish embryos at 16 hpf. Embryos were treated with different concentrations of BTDE. Vessels of zebrafish embryos were observed using a fluorescence microscope, photos were recorded by inverted fluorescence microscope (scale bar: 1.2 mm). (b) Quantification of intersegmental vessel growth induced by BTDE. Values represent the means ± SD of three independent experiments. * p < 0.05, ** p < 0.01 versus medium control. PHENOTYPE:
|

BTDE decreases the migration of A549, H1975 and the invasion of A549. The effect of BTDE on A549 (a) or H1975 (b) proliferation. A549 or H1975 was incubated with different concentrations of BTDE at 37 °C for 48 h, cell viability was determined by MTT assay. Wound healing of A549 after 36 h (c) or H1975 after 72 h (d) treatment with 0−10 μM BTDE was recorded with inverted microscope (original magnification, 4×; scale bar: 600 μm) and the wound healing area was measured by Image J software. Migration ability of A549 (e) or H1975 (f), invasion ability of A549 (g) treated with 0−10 μM BTDE for 24 h, photos were obtained by inverted microscope (original magnification, 10×; scale bar: 300 μm) and OD values of 570 nm were measured. Data are represented as mean ± SD of three independent experiments. * p < 0.05, ** p < 0.01 versus control. |

BTDE decreases the vasculogenic mimicry of A549 cells. (a) A549 was pretreated with BTDE for 24 h, then seeded on matrigel for 30 h, capillary-like structures of A549 were recorded by inverted microscope (original magnification, 4×; scale bar: 600 μm) and total length of tubes was measured by Image J software. ** p < 0.01 versus control. (b) Different concentrations of BTDE were added after tubes were established on matrigel for 6 h, and incubated for another 20 h. Tubular structures were observed by inverted microscope (original magnification, 4×; scale bar: 600 μm) and total length of tubes compared with 0 μM was measured by Image J software. (c) Western blot was used to measure the VEGF, HIF-1α, β-catenin, AKT, and ERK as well as their phosphorylation levels in A549 treated with BTDE for 24 h. Data are represented as mean ± SD of three independent experiments. ** p < 0.01 versus control. |