
- Title
-
Protease-dependent defects in N-cadherin processing drive PMM2-CDG pathogenesis
- Authors
- Klaver, E.J., Dukes-Rimsky, L., Kumar, B., Xia, Z.J., Dang, T., Lehrman, M.A., Angel, P., Drake, R.R., Freeze, H.H., Steet, R., Flanagan-Steet, H.
- Source
- Full text @ JCI Insight
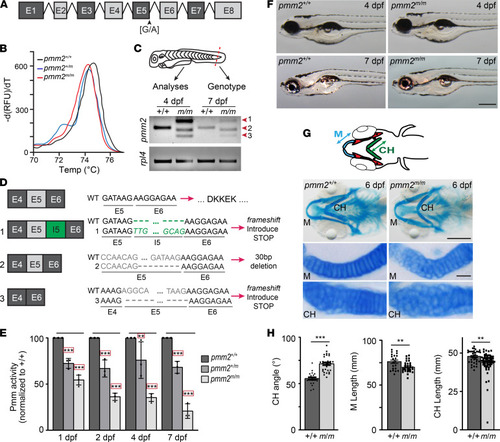
mRNA splicing is disrupted in pmm2m/m transcripts generating a hypomorphic allele.
(A) Schematic illustrates zebrafish pmm2. (B) High resolution melting curve (HRM) analysis shows melting curves for pmm2+/+, pmm2+/m (heterozygous for the sa10150 allele), and pmm2 [G/A] mutants homozygous for the sa10150 allele (pmm2m/m). (C) Schematic shows use of embryo fin for HRM genotyping. Reverse transcriptase PCR (RT-PCR) analyses reveal 3 unique pmm2 gene products in pmm2m/m embryos (forms 1–3). (D) Sequencing of individual RT-PCR products shows a frameshift in forms 1 and 3 with early stop codons. Form 2 contains an in-frame truncation of exon 5, explaining the hypomorphic allele. (E) Pmm activity measured in embryonic lysates shows a progressive decrease in activity in pmm2m/m embryos. n = 3 experiments of 25 embryos per sample. Error bars show SEM, Dunnett’s test, **P < 0.01, ***P < 0.001. (F) Bright-field images of embryos 4 and 7 dpf show no obvious differences between pmm2+/+ and pmm2m/m embryos. Scale bar: 100 μm. (G) Schematic illustrates several key structures of embryonic jaw, including Meckel’s cartilage (M) and the ceratohyal (CH), with arrowed lines demonstrating parameters measured. Alcian blue staining of ventral structures of 6 dpf embryos reveals differences in the shape of M and CH cartilages. Flatmount preparations show morphological alterations are associated with immature chondrocytes that are round and disorganized. n = 25–30 embryos per condition over 3 experiments. Scale bars: 10 μm. (H) Quantitation of CH cartilage angle, CH length, and M cartilage length show multiple pmm2+/+ and pmm2m/m embryos. n = 25–30 embryos per condition over 3 experiments. Error bars show SEM, Student’s t test, **P < 0.01, ***P < 0.001. |

Defects in synaptic development render pmm2m/m embryos progressively nonmotile.
(A) Eight to 14 dpf pmm2m/m embryos become progressively nonmotile. Graph shows number of nonmotile fish per day. Each colored dot represents the progeny from the same biological cross, such that all sibling animals collected on different days from that clutch are represented by the same-color dot. Genotyping showed all collected nonmotile embryos were pmm2m/m. (B) Lateral images of Petri dishes show pmm2m/m embryos lying on the bottom. Arrows indicate nonmotile pmm2m/m embryos. (C) pmm2m/m embryos die 9 to 14 dpf. Graph shows number of embryos dying each day. Each colored dot represents the progeny from the same biological cross, such that animals collected (on different days) from that clutch are siblings. (D) Schematic demonstrates Zebrabox behavioral analyses with 1 embryo placed per well and sensory deprived for 15 minutes. The swim paths, speeds, and general behavior are recorded for 10 minutes. Images of swim paths 6 to 12 dpf. Green paths indicate slow swim speed and red paths fast swim speeds. (E) Graphs show distance each embryo swam from 5–12 dpf at slow (upper) and fast (lower) swim speeds. n = >100 embryos per genotype over 5 experiments. Error bars show SEM, Student’s t test, *P < 0.05, **P < 0.01, ***P < 0.001, ****P < 0.0001. (F) Graph illustrates number of swim events initiated per embryo 5–12 dpf. (G) Graph illustrates percentage of embryos actively swimming 4–14 dpf. (H) Confocal images of neuromuscular systems. Motor axons are stained green with acetylated tubulin, and AChRs are stained red with bungarotoxin. Lateral images show higher power images of boxed regions. Arrowheads indicate immature, disorganized postsynaptic density. Scale bars: 20 µm and 8 µm. (I) Graphs show area of bungarotoxin staining. Each dot represents the average area of 15 synapses in an individual embryo. n = 8 embryos per condition. Error bars show SEM, Student’s t test, ****P < 0.0001. |

Defects in N-cadherin processing disrupt chondrogenesis in pmm2m/m embryos.
(A) Schematic representation of N-cadherin forms. N-cadherin contains a pro domain, 5 extracellular (EC1–EC5) domains, a transmembrane domain (62), and a cytosolic (CYTO) domain. Nonadhesive pro N-cadherin is proteolytically cleaved, creating mature N-cadherin (Mat). Additional processing generates signaling-competent N- and C- terminal fragments (NTF, CTF). (B) Schematic illustrates role of N-cadherin forms in chondrogenesis and synaptogenesis. Axons are shown in green and bungarotoxin-stained postsynaptic densities are red. (C) Representative N-cadherin Western blot reveals defects in processing in pmm2m/m embryos. n = 3 experiments with 15 embryos per sample per experiment. (D) Quantification of individual protein forms. Error bars show SEM, Student’s t test, ***P < 0.01. (E and F) Confocal images of chondrocytes stained immunohistochemically with N-cadherin (red) or β-catenin (green). Cell surface is stained with WGA (blue). White arrows highlight N-cadherin location. In +/+ it is primarily found at the cell poles, but in m/m N-cadherin interactions persist on opposing cell membranes. The yellow inset is a 2.5× magnification of the original panels of N-cadherin on opposing membranes. Yellow arrows highlight β-catenin location, and white dotted line highlights N-cadherin located laterally in elongated cells. Scale bars: 10 μm. (G) Graphs quantitating N-cadherin and β-catenin localization. Data presented as percentage cells within an individual cartilage. n = 10 embryos per genotype per age over 3 experiments. Error bars show SEM, Student’s t test, ****P < 0.0001. (H) Schematic illustrates model of N-cadherin localization and processing during normal and disrupted chondrogenesis. (I) The level of cell surface N-cadherin present in +/+ and m/m embryos. Shown is the percentage of total cells that are GFP+, GFP+ and N-cadherin+, or N-cadherin+. n = 3 experiments of 15, with cells isolated from pools of 15 embryos per sample. Error bars show SEM. |
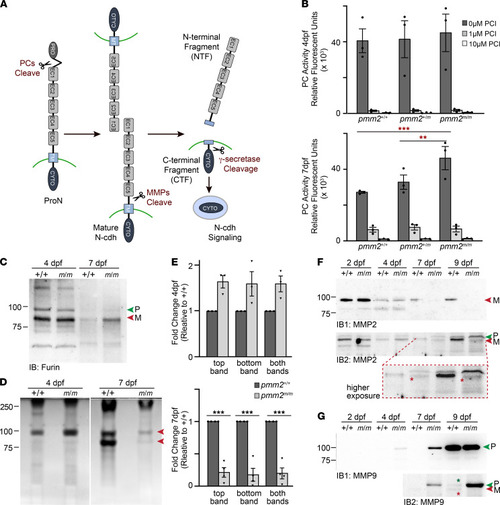
Proprotein convertase and Mmp activity is reduced in pmm2m/m embryos.
(A) Schematic of protease-mediated N-cadherin cleavage. (B) In vitro enzyme assays for PCs in embryo lysates show increased activity in pmm2m/m embryos 7 dpf. n = 3 experiments of 15 embryos per condition per sample. Error bars show SEM, Dunnett’s test, **P < 0.01, ***P < 0.001. (C) Western blot of Furin enzyme in embryo lysates; P (green arrow), pro form; M (red arrow), mature form. (D) Gelatin zymography of embryos shows decrease in gelatinase activity in pmm2m/m embryos 7 dpf (red arrows). (E) Graphs quantitate gelatinase activity. n = 4 experiments of 15 embryos per condition per sample. Error bars show SEM, Student’s t test, ***P < 0.001. (F) Two Western blots of Mmp2. Immunoblot 2 (IB2) is shown at higher exposure with a higher magnification “inset” that illustrates the pro and mature bands. Red stars highlight a shift in Mmp2’s molecular weight in pmm2m/m embryos relative to control embryos. n = 3 experiments with 15 embryos per sample per experiment. (G) Two Western blots of Mmp9. In immunoblot 2 stars denote the pro (green star) and mature (red star) forms of Mmp9 present in pmm2 control embryos, while only the pro form is noted in pmm2m/m embryos. n = 3 experiments with 15 embryos per sample per experiment. |

PC inhibition improves craniofacial phenotypes in pmm2m/m embryos.
(A) Pericardial injection of PC inhibitor. Confocal images of fli1a:EGFP-labeled cartilage structures show PCI injection improves chondrocyte morphology, organization, and differentiation in pmm2m/m embryos. White boxes, central portion of Meckel’s cartilage; orange boxes, lateral regions evaluated for phenotypic rescue. Scale bars: 10 μm. Percentage values indicate number of scored embryos exhibiting pictured phenotype. n = 30 embryos over 4 experiments. (B) Parameters assessed for rescue of central portion of Meckel’s cartilage (white boxes). Cells were scored for percentage of intercalated, ratio between long and short axis (measure of roundness), and percentage of cells with vacuoles. n = 8–15 treated embryos over 4 experiments. (C) Parameters assessed for rescue of lateral portion of Meckel’s cartilage (white boxes). Cells were scored as in B. n = 8–15 treated embryos over 4 experiments. (D) Experimental strategy involving injecting a morpholino targeting furina into mixed progeny of pmm2m/m incross at 1-cell stage and genotyping 3 dpf. Confocal images of fli1a:EGFP-labeled cartilage structures show inhibiting furina improves chondrocyte morphology, organization, and differentiation in pmm2m/m embryos. White boxes, central portion of Meckel’s cartilage; orange boxes, lateral regions evaluated for phenotypic rescue. Scale bars: 10 μm. Percentage values indicate the number of scored embryos exhibiting pictured phenotype. n = 8–15 treated embryos over 4 experiments. (E) Parameters assessed for rescue of central portion of Meckel’s cartilage (white boxes) following morpholino inhibition of furina. Cells were scored as in B. (F) Parameters assessed for rescue of lateral portion of Meckel’s cartilage (orange boxes) following morpholino inhibition of furina. Cells were scored as in B. Error bars show SEM, 2-way ANOVA, *P < 0.05, **P < 0.01, ***P < 0.0001, ****P < 0.0001. PHENOTYPE:
|

PC inhibition rescues molecular and cellular phenotypes.
(A) Schematic shows experimental workflow. (B) In-gel zymography shows reducing PCs improves gelatinase/Mmp activity in pmm2m/m embryos. (C) Graph illustrates densitometry-based quantitation of gelatinase activity. n = 4 experiments, each with 15 embryos per sample per experiment. Error bars show SEM, 2-way ANOVA, *P < 0.05, ***P < 0.001. (D) Representative Western blot of N-cadherin in embryonic lysates with and without PCI treatment. (E) Graph of densitometry-based quantitation of pro N-cadherin abundance. n = 4 experiments, each with 15 embryos per sample per experiment. Error bars show SEM, 2-way ANOVA, **P < 0.01, ***P < 0.001. (F) Schematic illustrates workflow of furina morpholino injection, genotyping, and analyses. (G) In-gel zymography shows reducing furina expression improves gelatinase/Mmp activity in pmm2m/m embryos. (H) Graph demonstrates densitometry-based quantitation of gelatinase. n = 4 experiments, each with 15 embryos per sample per experiment. Error bars show SEM, 2-way ANOVA, **P < 0.01, ***P < 0.001. (I) Representative Western blot of N-cadherin in embryonic lysates shows treatment does not improve abundance of the pro form in pmm2m/m embryos. n = 4 experiments, each with 15 embryos per sample per experiment. (J) Graph of densitometry-based quantitation of pro N-cadherin. Error bars show SEM. |

MALDI MS imaging reveals specific defects in N-glycosylation.
(A) Representative image of embryo sections analyzed by MALDI MS imaging. Individual areas imaged are outlined in red (pmm2m/m; n = 5) or blue (pmm2+/+; n = 7). Scale bar: 2 mm. (B) Overall average spectral comparison of pmm2+/+ and pmm2m/m demonstrates changes in N-glycosylation. Select contrasting high-mannose [Hex(n)] peaks are highlighted with arrows. (C and D) Representative images of complex-type N-glycans. Numbers on image panels correspond to bars on graph. Graph quantifying differences in complex glycans between pmm2+/+ and pmm2m/m embryos. Each dot represents quantification of peak intensity from a single embryo. Data represent mass to charge ratio (m/z) indicative of glycan identity. Error bar shows standard deviation, Mann-Whitney U test, P < 0.01 considered significant, *P < 0.01, **P < 0.001. (E and F) Representative images of high-mannose N-linked oligosaccharides. Numbers on image panels correspond to bars on graph. Graph quantifying differences in high-mannose N-linked oligosaccharides between pmm2+/+ and pmm2m/m embryos. Each dot represents quantification of peak intensity from a single embryo. Data represent m/z indicative of glycan identity. Error bar shows standard deviation, Mann-Whitney U test, *P < 0.01, **P < 0.001. (G and H) Representative images of truncated N-glycans. Graph quantifying differences in truncated sugars between pmm2+/+ and pmm2m/m embryos. Each dot represents quantification of peak intensity from a single embryo. Error bar shows standard deviation, Mann-Whitney U test, P < 0.01 considered significant, **P < 0.001. PHENOTYPE:
|