
Figure 4
- ID
- ZDB-IMAGE-220131-168
- Antibodies
- Publication
- Klaver et al., 2021 - Protease-dependent defects in N-cadherin processing drive PMM2-CDG pathogenesis
- All Figures
- Figures for Klaver et al., 2021
|
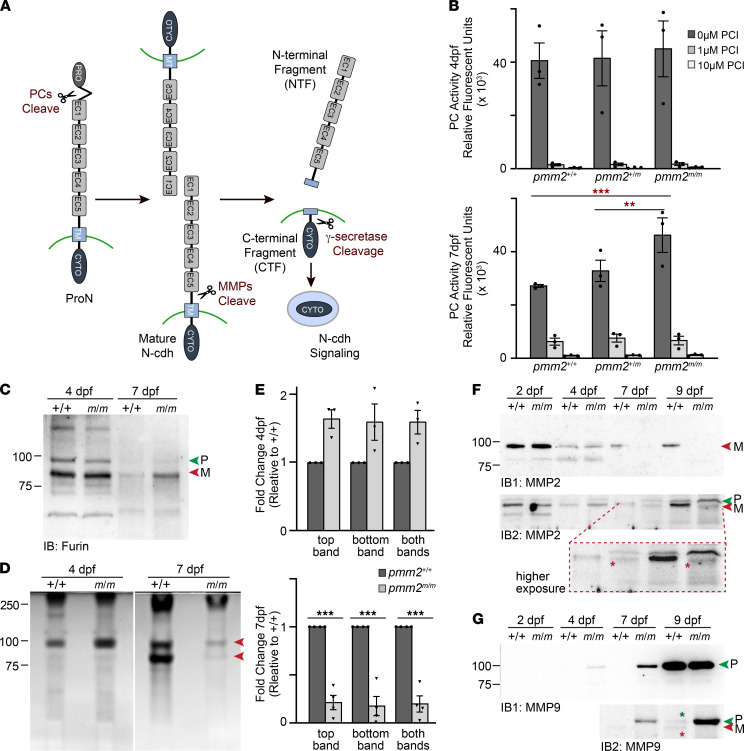
Figure 4
(A) Schematic of protease-mediated N-cadherin cleavage. (B) In vitro enzyme assays for PCs in embryo lysates show increased activity in pmm2m/m embryos 7 dpf. n = 3 experiments of 15 embryos per condition per sample. Error bars show SEM, Dunnett’s test, **P < 0.01, ***P < 0.001. (C) Western blot of Furin enzyme in embryo lysates; P (green arrow), pro form; M (red arrow), mature form. (D) Gelatin zymography of embryos shows decrease in gelatinase activity in pmm2m/m embryos 7 dpf (red arrows). (E) Graphs quantitate gelatinase activity. n = 4 experiments of 15 embryos per condition per sample. Error bars show SEM, Student’s t test, ***P < 0.001. (F) Two Western blots of Mmp2. Immunoblot 2 (IB2) is shown at higher exposure with a higher magnification “inset” that illustrates the pro and mature bands. Red stars highlight a shift in Mmp2’s molecular weight in pmm2m/m embryos relative to control embryos. n = 3 experiments with 15 embryos per sample per experiment. (G) Two Western blots of Mmp9. In immunoblot 2 stars denote the pro (green star) and mature (red star) forms of Mmp9 present in pmm2 control embryos, while only the pro form is noted in pmm2m/m embryos. n = 3 experiments with 15 embryos per sample per experiment.