Figure 1
- ID
- ZDB-FIG-220131-171
- Publication
- Klaver et al., 2021 - Protease-dependent defects in N-cadherin processing drive PMM2-CDG pathogenesis
- Other Figures
- All Figure Page
- Back to All Figure Page
|
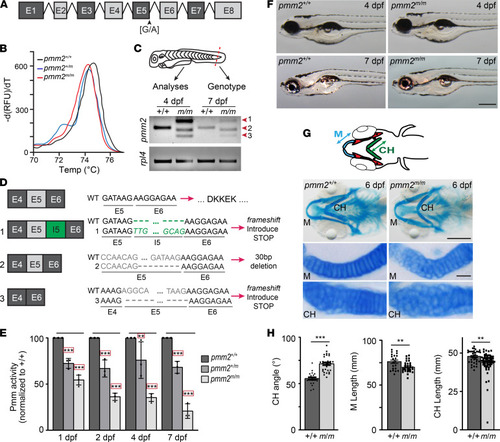
mRNA splicing is disrupted in pmm2m/m transcripts generating a hypomorphic allele.
(A) Schematic illustrates zebrafish pmm2. (B) High resolution melting curve (HRM) analysis shows melting curves for pmm2+/+, pmm2+/m (heterozygous for the sa10150 allele), and pmm2 [G/A] mutants homozygous for the sa10150 allele (pmm2m/m). (C) Schematic shows use of embryo fin for HRM genotyping. Reverse transcriptase PCR (RT-PCR) analyses reveal 3 unique pmm2 gene products in pmm2m/m embryos (forms 1–3). (D) Sequencing of individual RT-PCR products shows a frameshift in forms 1 and 3 with early stop codons. Form 2 contains an in-frame truncation of exon 5, explaining the hypomorphic allele. (E) Pmm activity measured in embryonic lysates shows a progressive decrease in activity in pmm2m/m embryos. n = 3 experiments of 25 embryos per sample. Error bars show SEM, Dunnett’s test, **P < 0.01, ***P < 0.001. (F) Bright-field images of embryos 4 and 7 dpf show no obvious differences between pmm2+/+ and pmm2m/m embryos. Scale bar: 100 μm. (G) Schematic illustrates several key structures of embryonic jaw, including Meckel’s cartilage (M) and the ceratohyal (CH), with arrowed lines demonstrating parameters measured. Alcian blue staining of ventral structures of 6 dpf embryos reveals differences in the shape of M and CH cartilages. Flatmount preparations show morphological alterations are associated with immature chondrocytes that are round and disorganized. n = 25–30 embryos per condition over 3 experiments. Scale bars: 10 μm. (H) Quantitation of CH cartilage angle, CH length, and M cartilage length show multiple pmm2+/+ and pmm2m/m embryos. n = 25–30 embryos per condition over 3 experiments. Error bars show SEM, Student’s t test, **P < 0.01, ***P < 0.001. |
| Gene: | |
|---|---|
| Fish: | |
| Anatomical Term: | |
| Stage Range: | Day 4 to Days 7-13 |
| Fish: | |
|---|---|
| Observed In: | |
| Stage Range: | Prim-5 to Days 7-13 |

