
Figure 6
- ID
- ZDB-IMAGE-220131-198
- Publication
- Klaver et al., 2021 - Protease-dependent defects in N-cadherin processing drive PMM2-CDG pathogenesis
- All Figures
- Figures for Klaver et al., 2021
|
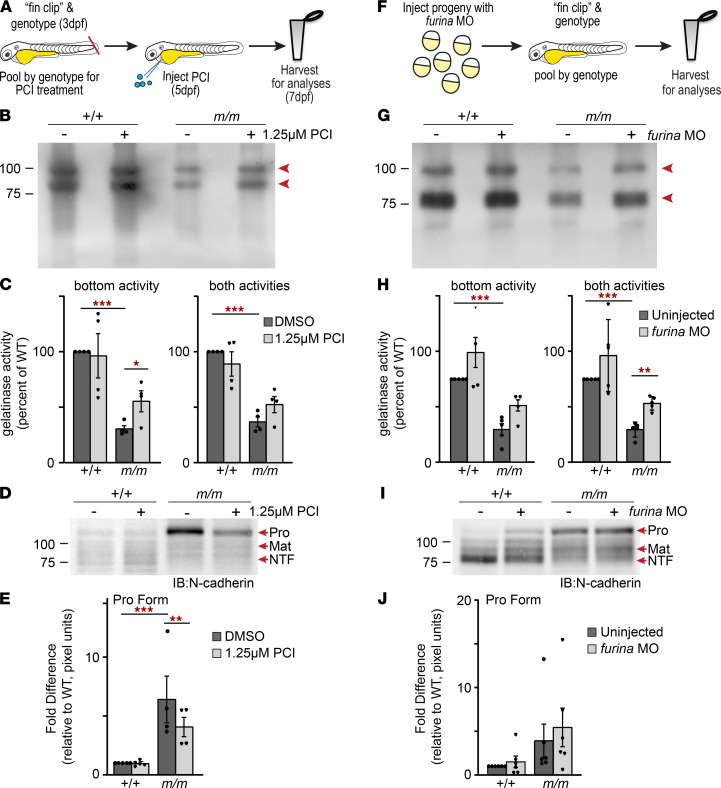
Figure 6
(A) Schematic shows experimental workflow. (B) In-gel zymography shows reducing PCs improves gelatinase/Mmp activity in pmm2m/m embryos. (C) Graph illustrates densitometry-based quantitation of gelatinase activity. n = 4 experiments, each with 15 embryos per sample per experiment. Error bars show SEM, 2-way ANOVA, *P < 0.05, ***P < 0.001. (D) Representative Western blot of N-cadherin in embryonic lysates with and without PCI treatment. (E) Graph of densitometry-based quantitation of pro N-cadherin abundance. n = 4 experiments, each with 15 embryos per sample per experiment. Error bars show SEM, 2-way ANOVA, **P < 0.01, ***P < 0.001. (F) Schematic illustrates workflow of furina morpholino injection, genotyping, and analyses. (G) In-gel zymography shows reducing furina expression improves gelatinase/Mmp activity in pmm2m/m embryos. (H) Graph demonstrates densitometry-based quantitation of gelatinase. n = 4 experiments, each with 15 embryos per sample per experiment. Error bars show SEM, 2-way ANOVA, **P < 0.01, ***P < 0.001. (I) Representative Western blot of N-cadherin in embryonic lysates shows treatment does not improve abundance of the pro form in pmm2m/m embryos. n = 4 experiments, each with 15 embryos per sample per experiment. (J) Graph of densitometry-based quantitation of pro N-cadherin. Error bars show SEM.