
- Title
-
1,25(OH)2D3 Inhibited Ferroptosis in Zebrafish Liver Cells (ZFL) by Regulating Keap1-Nrf2-GPx4 and NF-κB-hepcidin Axis
- Authors
- Cheng, K., Huang, Y., Wang, C.
- Source
- Full text @ Int. J. Mol. Sci.
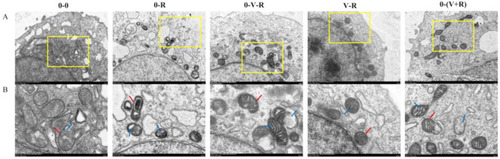
Effects of different incubation patterns of 1,25(OH)2D3 on morphological changes of ZFL mitochondria after being treated with 3 μM RSL3 for 6 h. Each group has two pictures, where picture (B) is an enlarged view of the yellow box area in picture (A), and the scale is marked on the bottom right of each picture. In (B), the red arrow indicates the mitochondrial membrane and the blue arrow indicates the cristae. |
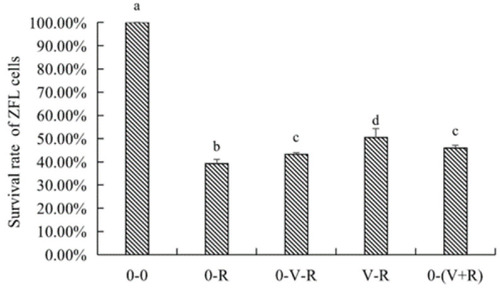
Effects of different incubation patterns of 1,25(OH)2D3 on survival rate of ZFL after being treated with 3 μM RSL3 for 6 h (n = 6). Error bars represent the standard error of each group. Means with different superscript letters (a, b, c, d) are significantly different (p < 0.05),while the same letter means no statistical difference between two groups. |
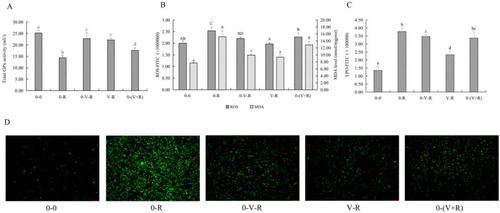
Effects of different incubation patterns of 1,25(OH)2D3 on total GPx activity (A), ROS and MDA level (B), and LPO level (C) of ZFL after being treated with 3 μM RSL3 for 6 h (n = 6). Distribution of ROS (green fluorescence) in ZFL in each incubation pattern (D). Distribution images of ROS were taken using an inverted fluorescent microscope (Leica DMi8, Germany) in the FITC green fluorescent channel with a magnification of 10×. Error bars represent the standard error of each group, and means with different superscript letters are significantly different (p < 0.05),while the same letter means no statistical difference between two groups. In figure B, uppercase letters (A, B, C, D) and lowercase letters (a, b, c, d) indicate the statistical difference of ROS level and MDA level in each group, respectively. |
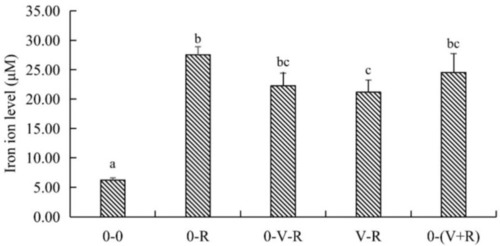
Effects of different incubation patterns of 1,25(OH)2D3 on iron ion level of ZFL after being treated with 3 μM RSL3 for 6 h (n = 6). Error bars represent the standard error of each group, and means with different superscript letters (a, b, c) are significantly different (p < 0.05),while the same letter means no statistical difference between two groups. |
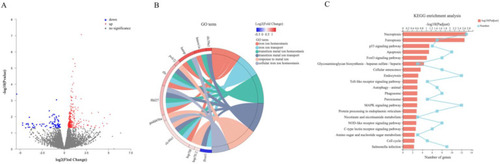
Volcano plots of differently expressed genes (DEGs) (A), chord diagram of signal pathways related to iron ion transport and metal ion transport (GO term) (B), and Top-20 pathways with the most significant enrichment by KEGG (C). All the DEGs were screened according to |log2(Fold change)| ≥ 1 and p-adjust < 0.05. In the volcano plots, the red dots represent upregulated genes, blue dots represent downregulated genes, and grey dots represent genes that do not meet the above screening conditions. Different colors in the chord graphs represent different signaling pathways, and log2(Fold change) value is shown in color gradient. In picture (C), the red bar represents the value of −log10(p-adjust) and the light blue line represents the number of genes in the corresponding signaling pathway. |
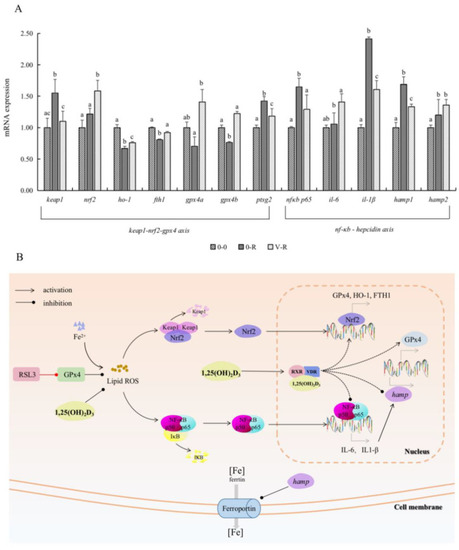
Effects of 1,25(OH)2D3 on the gene expression related to the Keap1–Nrf2–GPx4 and NF-κB–hepcidin axis (A) and visualization of Keap1–Nrf2–GPx4 axis and NF-κB–hepcidin axis (B). ZFL were collected for qPCR after being preincubated with 200 pM 1,25(OH)2D3 for 72 h and then treated with 3 μM RSL3 for 6 h. Values are presented as means (n = 6) and error bars represent the standard error of each group. Means with different superscript letters (a, b, c) are significantly different (p < 0.05), while the same letter means no statistical difference between two groups. Abbreviations in (B): RSL3, specific inhibitor of GPx4; GPx4, glutathione peroxidase 4; ROS, reactive oxygen species; Keap1, Kelch-like ECH-associated protein-1; Nrf2, nuclear factor erythroid 2-related factor 2; NF-κB p65, nuclear factor kappa B p65; IκB, inhibitor of nuclear factor kappa-B; IL-6, interleukin 6; IL-1β, interleukin 1β; RXR, retinoid X receptor; VDR, vitamin D receptor; hamp, hepcidin antimicrobial peptide gene; HO-1, heme oxygenase-1; FTH1, ferritin heavy chain 1. |