
|
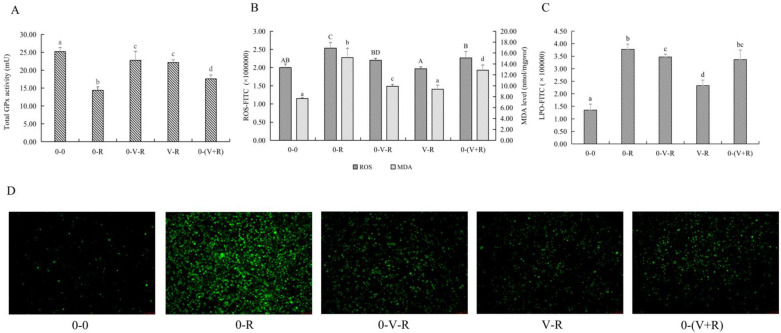
Figure 3
Effects of different incubation patterns of 1,25(OH)2D3 on total GPx activity (A), ROS and MDA level (B), and LPO level (C) of ZFL after being treated with 3 μM RSL3 for 6 h (n = 6). Distribution of ROS (green fluorescence) in ZFL in each incubation pattern (D). Distribution images of ROS were taken using an inverted fluorescent microscope (Leica DMi8, Germany) in the FITC green fluorescent channel with a magnification of 10×. Error bars represent the standard error of each group, and means with different superscript letters are significantly different (p < 0.05),while the same letter means no statistical difference between two groups. In figure B, uppercase letters (A, B, C, D) and lowercase letters (a, b, c, d) indicate the statistical difference of ROS level and MDA level in each group, respectively.