
|
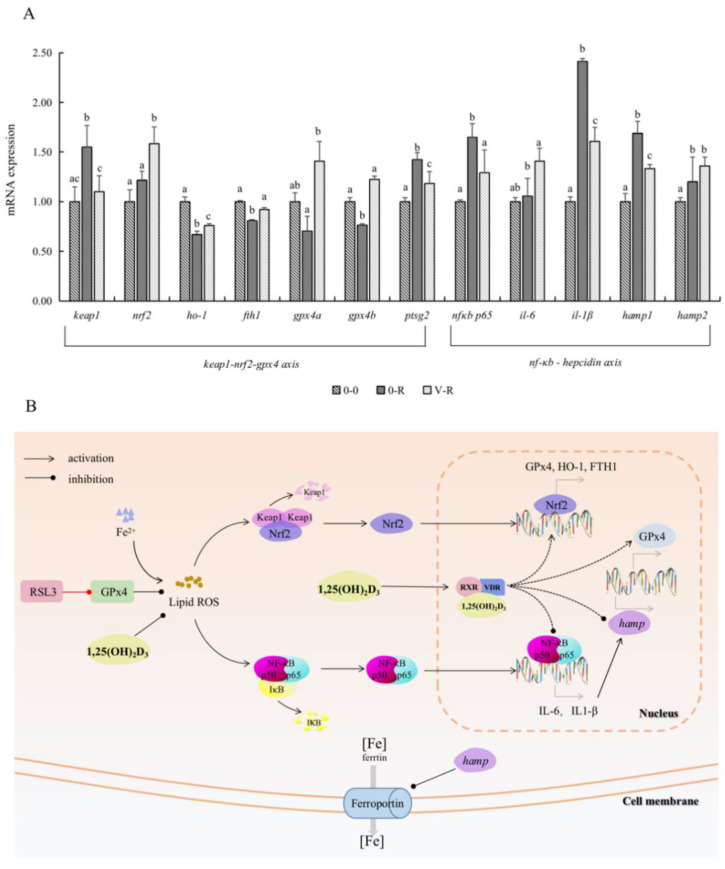
Figure 6
Effects of 1,25(OH)2D3 on the gene expression related to the Keap1–Nrf2–GPx4 and NF-κB–hepcidin axis (A) and visualization of Keap1–Nrf2–GPx4 axis and NF-κB–hepcidin axis (B). ZFL were collected for qPCR after being preincubated with 200 pM 1,25(OH)2D3 for 72 h and then treated with 3 μM RSL3 for 6 h. Values are presented as means (n = 6) and error bars represent the standard error of each group. Means with different superscript letters (a, b, c) are significantly different (p < 0.05), while the same letter means no statistical difference between two groups. Abbreviations in (B): RSL3, specific inhibitor of GPx4; GPx4, glutathione peroxidase 4; ROS, reactive oxygen species; Keap1, Kelch-like ECH-associated protein-1; Nrf2, nuclear factor erythroid 2-related factor 2; NF-κB p65, nuclear factor kappa B p65; IκB, inhibitor of nuclear factor kappa-B; IL-6, interleukin 6; IL-1β, interleukin 1β; RXR, retinoid X receptor; VDR, vitamin D receptor; hamp, hepcidin antimicrobial peptide gene; HO-1, heme oxygenase-1; FTH1, ferritin heavy chain 1.