
|
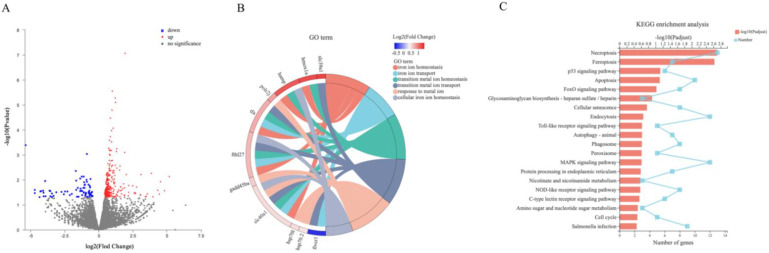
Figure 5
Volcano plots of differently expressed genes (DEGs) (A), chord diagram of signal pathways related to iron ion transport and metal ion transport (GO term) (B), and Top-20 pathways with the most significant enrichment by KEGG (C). All the DEGs were screened according to |log2(Fold change)| ≥ 1 and p-adjust < 0.05. In the volcano plots, the red dots represent upregulated genes, blue dots represent downregulated genes, and grey dots represent genes that do not meet the above screening conditions. Different colors in the chord graphs represent different signaling pathways, and log2(Fold change) value is shown in color gradient. In picture (C), the red bar represents the value of −log10(p-adjust) and the light blue line represents the number of genes in the corresponding signaling pathway.