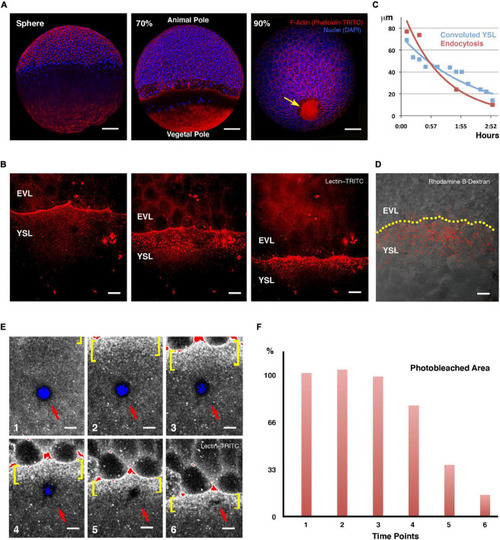
Yolk cell membrane endocytosis at the E-YSL. (A) Blastoderm expansion during epiboly. At sphere stage epiboly has not yet begun (left). F-actin accumulates at the periphery of all cells as well as in the yolk cell, mainly at the vegetal cap. At 70% epiboly (middle), the blastoderm has crossed the equator and will decrease its margin until closure. A belt of actin develops at the E-YSL ahead of the EVL and an actin-free zone separates this belt from a vegetal actin-rich patch. At 90% epiboly (right), the E-YSL and the vegetal actin-rich patch merge at the vegetal pole (arrow). Embryos were stained with phalloidin-TRITC (red) and DAPI (blue). Scale bars 100 μm. (B) Sequential images of a confocal time-lapse video of a wild type embryo soaked in lectin–TRITC for 5 min at sphere stage. The lectin binds to the membrane of both the yolk cell and the EVL cells and gets internalized accumulating in vesicles in the E-YSL just ahead of the EVL margin (from Supplementary Movie 1). EVL and YSL are indicated. Scale bar 25 μm. All confocal images are maximum projections. (C) Parallel reduction of the width of the convoluted E-YSL domain (blue) and the area undergoing membrane removal (red) during epiboly progression. X and Y axes represent hours after 50% epiboly and width in μm, respectively. (D) Uptake of fluorescent dextran (red) at the E-YSL just ahead of the EVL margin (yellow dots) at 65% epiboly. Scale bar 25 μm. (E) Snapshots of time-lapse images (from Supplementary Movie 2) of a lectin-TRITC soaked embryo (levels color coded as a range indicator) showing a circular photobleached area (red arrow) in the yolk cell away from the EVL leading edge. The photobleached membrane is removed and endocytosed only upon its enclosure within the advancing E-YSL (yellow brackets). All confocal images are maximum projections. Scale bar 25 μm. (F) Membrane internalization dynamics. Histograms depicting the percentage of the photobleached area reduction (red) at each regular sequential time points in (E). The removal of the photobleached membrane initiates once becomes a part of the convoluted area ahead of the leading front (from time 4 onward).

Endocytosis and Epiboly are impaired after rab5ab depletion. (A) Lectin-TRITC internalization was reduced at doming stage in rab5ab (right) compared to sibling controls YMOs (left). EVL and the YSL are indicated. The EVL/YSL border is highlighted. Top panels show Lectin (red) and bright field overlays. Images are confocal maximum projections. Scale bar 25 μm. (B) Yolk cell depletion of rab5ab results in epiboly delay without affecting other gastrulation movements [Control (left) and rab5ab YMOs (right)]. Top panels show Phalloidin-TRITC (red) staining of a control YMO at the end of epiboly and a sibling medium dose rab5ab YMOs of the same age. Lateral views. Bottom panels show membrane-GFP (Tg (β-actin:m-GFP) YMOs at 24 HPF. rab5ab YMOs present an open back phenotype but succeed in other gastrulation movements leading to somite formation (arrow). Images are confocal maximum projections. Scale bar 100 μm. (C–E) YMOs show a dose dependent epiboly delay. Macroscopic bright field images of sibling controls (C) and medium (4 ng) (D) and high (8 ng) dose (E)rab5ab YMOs (from Supplementary Movies 4, 5). Medium and high dose YMOs remained at 70 and 40% epiboly respectively when control siblings have already closed. Embryos were imaged in their chorion. The Animal and Vegetal Poles are indicated. Scale bar 250 μm.

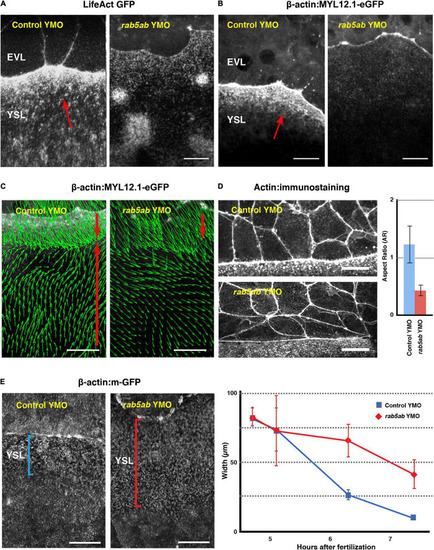
Cytoskeleton dynamics and EVL leading cells shapes are affected by rab5ab depletion. (A) Actin fails to accumulate at the E-YSL in rab5ab YMOs versus controls (Control YMO). Time-lapse snapshots of two LifeAct GFP injected sibling embryos. (B) Myosin fails to accumulate at the E-YSL of rab5ab YMOs versus controls (Control YMO). Time-lapse snapshots of two Myosin-GFP transgenic [Tg (β-actin:MYL12.1-eGFP)] sibling embryos. Note the delay in the progression of the EVL and the weaker accumulation of actin (A) and myosin (B) in the rab5ab YMOs. EVL and YSL are indicated. Red arrows point to the F-Actin belt and myosin accumulation in (A) and (B) respectively ahead of the EVL on the YSL. Scale bar 25 μm. (C) Myosin cortical retrograde flows. PIV of time-lapse snapshots of Tg (β-actin:MYL12.1-eGFP) embryos at 40% epiboly (from Supplementary Movie 7). Notice the vegetalward movement of cells and E-YSL (red top arrows) and the retrograde animalward cortical flow from the yolk cell vegetal pole sinking at the E-YSL (red bottom arrows), which fails in the rab5ab YMOs. Scale bar 25 μm. (D) Comparing leading EVL cells (left panels) of control siblings (Control YMO - top) and rab5ab YMOs (bottom) at 70% epiboly shows that they flatten and elongate latitudinally in mutant conditions. Actin was stained with phalloidin-TRITC. Scale bars 25 μm. All confocal images are maximum projections. This phenotype was quantified (on the right) by calculating the aspect ratio (animal to vegetal vs. latitudinal - Y axis) of leading EVL cells of control siblings (n = 15) (red) and rab5ab YMOs (n = 15) (blue) embryos. The leading EVL cells flatten at their front and elongate latitudinally in rab5ab morphants. Standard deviations are shown. P-value < 0.001. (E) E-YSL contraction is delayed in rab5ab YMOs. Snapshots at 7.5 HPF from surface projections of membrane-GFP (Tg (β-actin:m-GFP) rab5ab and sibling YMOs (Left Panels). Between 4.5 to 7.5 HPF, the E-YSL width is reduced from 80 to 10 μm as an average in controls (n = 5) (blue), but from 80 to 40 μm in rab5ab YMOs (n = 5) (red). Standard Deviations are shown. P-value < 0.001 from 6 h onward.

Biomechanics of yolk cell endocytosis impaired embryos. (A) Yolk granules flows patterns are altered in rab5ab YMOs. PIV of time-lapse snapshots imaged by two-photon microscopy of a Tg (β-actin:m-GFP) rab5ab YMO (see Supplementary Movies 8, 9). From epiboly onset, yolk granules flows are uncoordinated in rab5ab YMOs. The internal toroidal vortices characteristic of epiboly progression (Hernandez-Vega et al., 2017) do not form or are severely reduced and the laminar flows become asymmetrically distributed. Animal (A) and vegetal (V) poles are indicated. (B) Mechanical power density maps over time obtained by HR analysis in rab5ab YMO (from Supplementary Movie 10). The Relative Mean Square Error (RMSE) of the inferred power maps is shown as a percentage at the top left of each panel expressing the fitting accuracy. Qualitatively, rab5ab YMOs display no differences with wild type embryos in the spatial distribution of mechanical work (Hernandez-Vega et al., 2017) but exhibit a strong delay and an overall decrease of power of about four-fold. Arrow points to the highest power value at 70% epiboly at the E-YSL. Scale bar 25 μm. (C) Longitudinal along the AV axis (red) and latitudinal or circumferential - CC (green) stresses and their differences (blue) along the embryo cortex in a membrane-GFP transgenic [Tg (β-actin:m-GFP)] rab5ab YMO (from Supplementary Movie 12). Stresses were plotted as a function of the φ angle from animal to vegetal (40, 50, and 65% epiboly). The equator - dotted yellow line -, yolk cell surface - purple shadow - and the RMSE of the dynamic pressure (fitting accuracy) as a percentage for each time point are displayed. The latitudinal stress does not steep up from animal to vegetal until 70% epiboly, while the longitudinal stress oscillations are sustained.

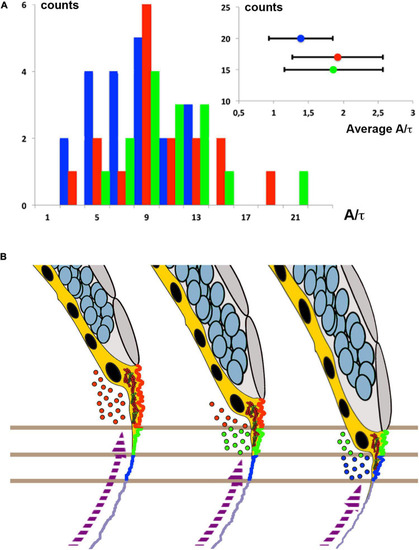
Membrane cortical tension and endocytosis at the E-YSL are necessary for epiboly progression. (A) The distribution (counts) of instant retraction velocities (A/t) after laser surgery of the actomyosin cortex of Myosin-GFP (Tg (β-actin:MYL12.1-eGFP) rab5ab YMOs at 55% epiboly (blue) shows a significant reduction (Wilcoxon test p < 0.01) versus wild type (red) and control YMOs (green). The instant velocity estimate was extracted from the exponential fit of the distance between fronts (see section “MATERIALS AND METHODS”). The averaged instant retraction velocity (A/t) for rab5ab YMOs was 1.39 ± 0.46 μm (n = 20), while control YMOs reach 1.86 ± 0.71 μm (n = 17) and wild type embryos 1.92 ± 0.65 μm (n = 15) (inset). Counts represent the number of analyzed laser cuts for each condition. (B) Proposed model of epiboly progression. The contractile E-YSL and the imbalance of stiffness between the EVL and the yolk cell surface account for epiboly progression. Rab5ab-mediated yolk cell localized endocytosis (color coded dots) accounts for the reduction of the yolk cell surface coupled to the progression of EVL (gray) and DCs (blue) toward the vegetal pole. Membrane removal associates to the convolution and contraction of the E-YSL surface and the recruitment of actin and myosin (purple dashed arrow) from vegetally located pools. Three chronological time points are shown. Different sequential zones on the surface of the E-YSL are color-coded. Actin and myosin are diagrammatically illustrated in red and green within the YSL (yellow).

Acknowledgments
This image is the copyrighted work of the attributed author or publisher, and ZFIN has permission only to display this image to its users. Additional permissions should be obtained from the applicable author or publisher of the image. Full text @ Front Cell Dev Biol