IMAGE

FIGURE 2

ID
ZDB-IMAGE-211118-17
Source
Figures for Marsal et al., 2021
Image
Figure Caption

FIGURE 2

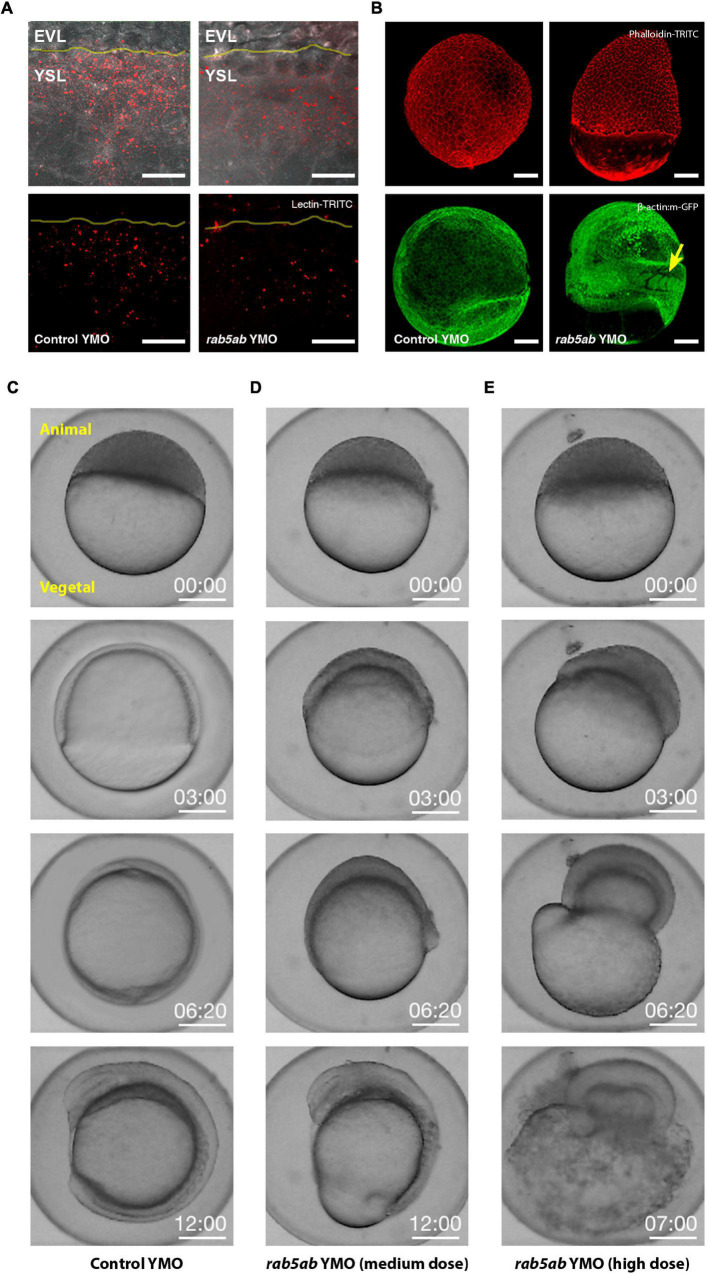
Endocytosis and Epiboly are impaired after rab5ab depletion. (A) Lectin-TRITC internalization was reduced at doming stage in rab5ab (right) compared to sibling controls YMOs (left). EVL and the YSL are indicated. The EVL/YSL border is highlighted. Top panels show Lectin (red) and bright field overlays. Images are confocal maximum projections. Scale bar 25 μm. (B) Yolk cell depletion of rab5ab results in epiboly delay without affecting other gastrulation movements [Control (left) and rab5ab YMOs (right)]. Top panels show Phalloidin-TRITC (red) staining of a control YMO at the end of epiboly and a sibling medium dose rab5ab YMOs of the same age. Lateral views. Bottom panels show membrane-GFP (Tg (β-actin:m-GFP) YMOs at 24 HPF. rab5ab YMOs present an open back phenotype but succeed in other gastrulation movements leading to somite formation (arrow). Images are confocal maximum projections. Scale bar 100 μm. (C–E) YMOs show a dose dependent epiboly delay. Macroscopic bright field images of sibling controls (C) and medium (4 ng) (D) and high (8 ng) dose (E)rab5ab YMOs (from Supplementary Movies 4, 5). Medium and high dose YMOs remained at 70 and 40% epiboly respectively when control siblings have already closed. Embryos were imaged in their chorion. The Animal and Vegetal Poles are indicated. Scale bar 250 μm.

Acknowledgments
This image is the copyrighted work of the attributed author or publisher, and ZFIN has permission only to display this image to its users. Additional permissions should be obtained from the applicable author or publisher of the image. Full text @ Front Cell Dev Biol