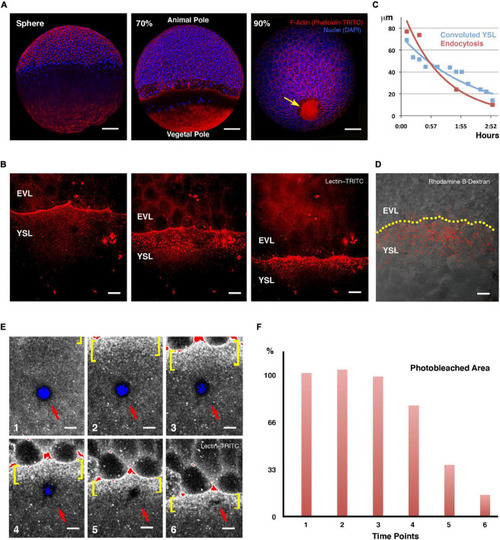
Yolk cell membrane endocytosis at the E-YSL. (A) Blastoderm expansion during epiboly. At sphere stage epiboly has not yet begun (left). F-actin accumulates at the periphery of all cells as well as in the yolk cell, mainly at the vegetal cap. At 70% epiboly (middle), the blastoderm has crossed the equator and will decrease its margin until closure. A belt of actin develops at the E-YSL ahead of the EVL and an actin-free zone separates this belt from a vegetal actin-rich patch. At 90% epiboly (right), the E-YSL and the vegetal actin-rich patch merge at the vegetal pole (arrow). Embryos were stained with phalloidin-TRITC (red) and DAPI (blue). Scale bars 100 μm. (B) Sequential images of a confocal time-lapse video of a wild type embryo soaked in lectin–TRITC for 5 min at sphere stage. The lectin binds to the membrane of both the yolk cell and the EVL cells and gets internalized accumulating in vesicles in the E-YSL just ahead of the EVL margin (from Supplementary Movie 1). EVL and YSL are indicated. Scale bar 25 μm. All confocal images are maximum projections. (C) Parallel reduction of the width of the convoluted E-YSL domain (blue) and the area undergoing membrane removal (red) during epiboly progression. X and Y axes represent hours after 50% epiboly and width in μm, respectively. (D) Uptake of fluorescent dextran (red) at the E-YSL just ahead of the EVL margin (yellow dots) at 65% epiboly. Scale bar 25 μm. (E) Snapshots of time-lapse images (from Supplementary Movie 2) of a lectin-TRITC soaked embryo (levels color coded as a range indicator) showing a circular photobleached area (red arrow) in the yolk cell away from the EVL leading edge. The photobleached membrane is removed and endocytosed only upon its enclosure within the advancing E-YSL (yellow brackets). All confocal images are maximum projections. Scale bar 25 μm. (F) Membrane internalization dynamics. Histograms depicting the percentage of the photobleached area reduction (red) at each regular sequential time points in (E). The removal of the photobleached membrane initiates once becomes a part of the convoluted area ahead of the leading front (from time 4 onward).
|
