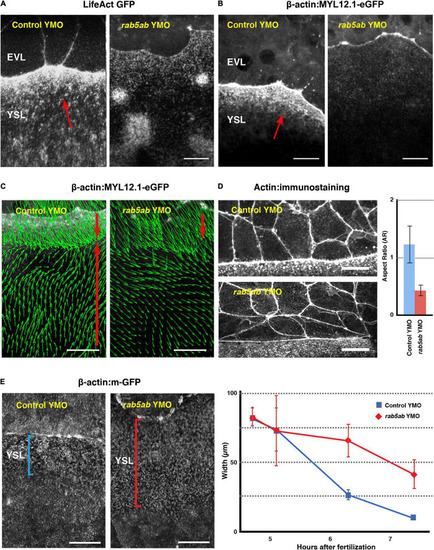
Cytoskeleton dynamics and EVL leading cells shapes are affected by rab5ab depletion. (A) Actin fails to accumulate at the E-YSL in rab5ab YMOs versus controls (Control YMO). Time-lapse snapshots of two LifeAct GFP injected sibling embryos. (B) Myosin fails to accumulate at the E-YSL of rab5ab YMOs versus controls (Control YMO). Time-lapse snapshots of two Myosin-GFP transgenic [Tg (β-actin:MYL12.1-eGFP)] sibling embryos. Note the delay in the progression of the EVL and the weaker accumulation of actin (A) and myosin (B) in the rab5ab YMOs. EVL and YSL are indicated. Red arrows point to the F-Actin belt and myosin accumulation in (A) and (B) respectively ahead of the EVL on the YSL. Scale bar 25 μm. (C) Myosin cortical retrograde flows. PIV of time-lapse snapshots of Tg (β-actin:MYL12.1-eGFP) embryos at 40% epiboly (from Supplementary Movie 7). Notice the vegetalward movement of cells and E-YSL (red top arrows) and the retrograde animalward cortical flow from the yolk cell vegetal pole sinking at the E-YSL (red bottom arrows), which fails in the rab5ab YMOs. Scale bar 25 μm. (D) Comparing leading EVL cells (left panels) of control siblings (Control YMO - top) and rab5ab YMOs (bottom) at 70% epiboly shows that they flatten and elongate latitudinally in mutant conditions. Actin was stained with phalloidin-TRITC. Scale bars 25 μm. All confocal images are maximum projections. This phenotype was quantified (on the right) by calculating the aspect ratio (animal to vegetal vs. latitudinal - Y axis) of leading EVL cells of control siblings (n = 15) (red) and rab5ab YMOs (n = 15) (blue) embryos. The leading EVL cells flatten at their front and elongate latitudinally in rab5ab morphants. Standard deviations are shown. P-value < 0.001. (E) E-YSL contraction is delayed in rab5ab YMOs. Snapshots at 7.5 HPF from surface projections of membrane-GFP (Tg (β-actin:m-GFP) rab5ab and sibling YMOs (Left Panels). Between 4.5 to 7.5 HPF, the E-YSL width is reduced from 80 to 10 μm as an average in controls (n = 5) (blue), but from 80 to 40 μm in rab5ab YMOs (n = 5) (red). Standard Deviations are shown. P-value < 0.001 from 6 h onward.
|
