
- Title
-
Microscopic multifrequency MR elastography for mapping viscoelasticity in zebrafish
- Authors
- Jordan, J.E.L., Bertalan, G., Meyer, T., Tzschätzsch, H., Gauert, A., Bramè, L., Herthum, H., Safraou, Y., Schröder, L., Braun, J., Hagemann, A.I.H., Sack, I.
- Source
- Full text @ Magn Reson Med

Setup for MRE of zebrafish in a 7T preclinical MRI scanner. (A) A piezoelectric actuation unit, shown in red, generates harmonic oscillations synchronized to the MRE sequence. The principal vibration direction is along the cylinder axis, which results in predominantly cylindrical waves. The box demarcates the area covered by the imaging slice slab. The custom volume resonator coil is also shown. (B) MRE magnitude image (grayscale) and wave images of different frequencies (color scale) showing the through-plane wave component, which was encoded by the sequence. MRE, MR elastography; T, tesla |

(A) Unfiltered wave images at different resolutions (columns) and frequencies (rows). (B) SWS (left) and φ (right) values determined by our processing pipeline plotted against wave displacement SNR. Bessel fits of the unfiltered complex-valued cylinder waves result in ground truths of 0.77 m/s ± 0.09 m/s SWS and 0.30 ± 0.08 rad φ and are shown as dotted red line with SD as a shaded area. Both SWS values as well as φ determined by our pipeline fall within the ground truth for all resolutions. The percent error between the ground truth and the values at 60 × 60 µm2 are 5% for the SWS and 10% for φ. (C) Comparison of tabletop MRE with 7T MRE both analyzed using frequency-resolved Bessel functions and frequency compounded k-MDEV inversion at 60 × 60 µm2. Between 1000 and 1400 Hz, all measurements fall into the same SD range (thickness of the horizontal red line indicates SD). The percent error between the Bessel-based SWS at 7T and the k-MDEV based SWS was 5%, whereas the percent error between the Bessel-based SWS at 0.5T and the k-MDEV measurement was 9%. φ, loss angle; MDEV, multifrequency dual elasto-visco; SWS, shear wave speed |
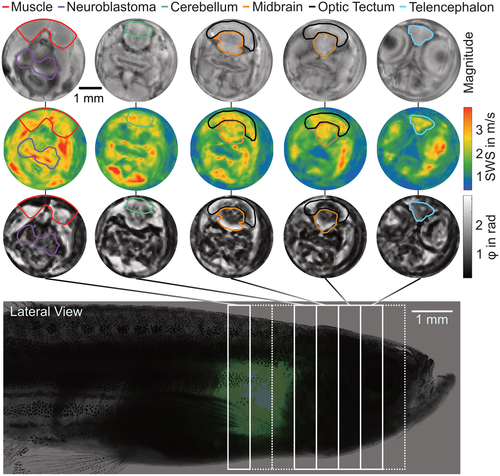
Representative data obtained in a transgenic zebrafish. The first row shows absolute wave magnitude maps, with coronal slices from posterior to anterior. SWS and φ maps of the respective slices are shown in the second and third rows, respectively. Anatomical regions relevant in our study are marked in all maps. The bottom row shows approximate slice positioning overlaid over a composite microscopy image of an anesthetized zebrafish that shows general anatomy, with GFP indicating the tumor through the semitransparent skin. GFP, green fluorescent protein |

Comparison of SWS as well as φ maps and histology. TH and H&E staining reveal cancerous cells in green and purple, which can then be identified in the magnitude, SWS, and φ maps. Note the different thicknesses of the slices, with histology slices being significantly thinner (<4 µm) than MRE slices (600 µm). The cancerous region is marked in purple. H&E, hematoxylin and eosin; TH, tyrosine hydroxylase |
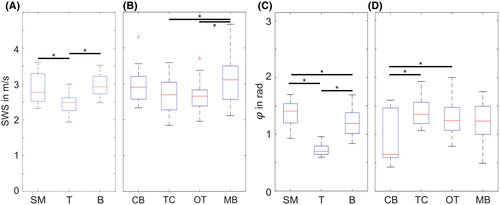
Group SWS (A,B) and loss angle values (C,D) for SM, T, B, CB, TC, OT, and MB. In (B) and (D), transgenic zebrafish and wild-type zebrafish were pooled, whereas (A) and (C) only show transgenic fish. Significant differences (p < .05) are indicated by asterisks. B, whole brain; CB, cerebellum; MB, midbrain; OT, optic tectum; SM, skeletal muscle; T, neuroblastoma; TC, telencephalon |