
FIGURE
Fig. 3
- ID
- ZDB-FIG-230205-29
- Publication
- Jordan et al., 2021 - Microscopic multifrequency MR elastography for mapping viscoelasticity in zebrafish
- Other Figures
- All Figure Page
- Back to All Figure Page
Fig. 3
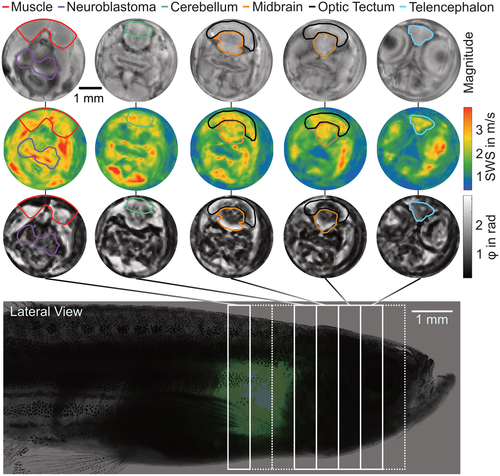
Representative data obtained in a transgenic zebrafish. The first row shows absolute wave magnitude maps, with coronal slices from posterior to anterior. SWS and φ maps of the respective slices are shown in the second and third rows, respectively. Anatomical regions relevant in our study are marked in all maps. The bottom row shows approximate slice positioning overlaid over a composite microscopy image of an anesthetized zebrafish that shows general anatomy, with GFP indicating the tumor through the semitransparent skin. GFP, green fluorescent protein |
Expression Data
Expression Detail
Antibody Labeling
Phenotype Data
Phenotype Detail
Acknowledgments
This image is the copyrighted work of the attributed author or publisher, and
ZFIN has permission only to display this image to its users.
Additional permissions should be obtained from the applicable author or publisher of the image.
Full text @ Magn Reson Med