
FIGURE
Fig. 5
- ID
- ZDB-FIG-230205-31
- Publication
- Jordan et al., 2021 - Microscopic multifrequency MR elastography for mapping viscoelasticity in zebrafish
- Other Figures
- All Figure Page
- Back to All Figure Page
Fig. 5
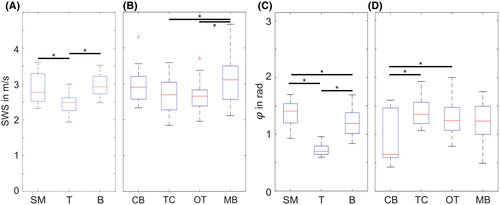
Group SWS (A,B) and loss angle values (C,D) for SM, T, B, CB, TC, OT, and MB. In (B) and (D), transgenic zebrafish and wild-type zebrafish were pooled, whereas (A) and (C) only show transgenic fish. Significant differences (p < .05) are indicated by asterisks. B, whole brain; CB, cerebellum; MB, midbrain; OT, optic tectum; SM, skeletal muscle; T, neuroblastoma; TC, telencephalon |
Expression Data
Expression Detail
Antibody Labeling
Phenotype Data
Phenotype Detail
Acknowledgments
This image is the copyrighted work of the attributed author or publisher, and
ZFIN has permission only to display this image to its users.
Additional permissions should be obtained from the applicable author or publisher of the image.
Full text @ Magn Reson Med