
Image
|
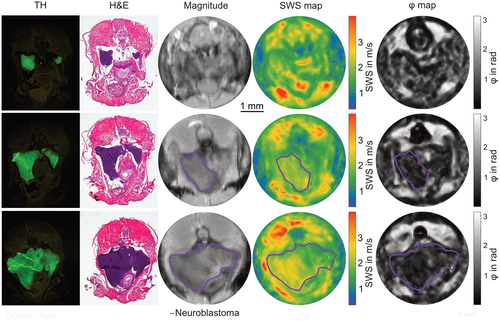
Figure Caption
Fig. 4 Comparison of SWS as well as φ maps and histology. TH and H&E staining reveal cancerous cells in green and purple, which can then be identified in the magnitude, SWS, and φ maps. Note the different thicknesses of the slices, with histology slices being significantly thinner (<4 µm) than MRE slices (600 µm). The cancerous region is marked in purple. H&E, hematoxylin and eosin; TH, tyrosine hydroxylase
Acknowledgments
This image is the copyrighted work of the attributed author or publisher, and
ZFIN has permission only to display this image to its users.
Additional permissions should be obtained from the applicable author or publisher of the image.
Full text @ Magn Reson Med