
- Title
-
Nxhl Controls Angiogenesis by Targeting VE-PTP Through Interaction With Nucleolin
- Authors
- Luo, H., Zhang, Y., Deng, Y., Li, L., Sheng, Z., Yu, Y., Lin, Y., Chen, X., Feng, P.
- Source
- Full text @ Front Cell Dev Biol

Evolutionary conservation of nxhl in vertebrate. (A) WGCNA analysis of embryonic development stages revealed gene-network modules enriched. HBS, EGS and MGS are classified into one group. OSP, oosperm; MS, morula stage; HBS, high blastula stage; EGS, early gastrula stage; MGS, middle gastrula stage; LGS, late gastrula stage; EFS, embryo formed stage; OpVS, optic vesicle stage; OtVS, otocyst vesicle stage; HPS, heart pulsation stage; FELS, formation of eye lens; NHLS, newly hatched larvae; YAPS, yolk absorption period. (B) Validation of expression level for nxhl by qPCR technology. 18s RNA was considered as internal marker. Gene structure of nxhl was showed at upper region. (C) Domains of nxhl and other homologous protein. The domain DDE_Tnp_4 was identified in SMART database (http://smart.embl.de/). (D) Micro-synteny analysis of nxh locus among spotted gar, zebrafish, gold pompano and stickleback. Two inversions and one insertion occurred in nxh locus region of golden pompano genomes. (E) The distribution of nxhl in zebrafish embryo by using whole-mount embryo in situ hybridization (WISH) and qPCR. Cmlc was used as positive control. Nxhl is mainly distributed in maternal developmental stages in zebrafish embryo. |

Nxhl regulates vascular development in vivo. (A–F) Gross morphology at 2-dpf and 3-dpf. Compared with control zebrafish, nxhl knock-down causes pericardial oedema (B,C,E,F, red arrowheads) and circulation defects. Heart beat and circulation in caudal vein (CV) is visible in the control fish, but is abnormal in nxhl morphants (Supplementary Videos 1, 2). (G) A time-course plot of percent survival in control vs. nxhl morphants for 3 days. (H) Shows the percentage of embryos with development defects. (I) Quantification of the pericardial area of embryos. Error bars, mean ± SEM; ***p < 0.0001 (n = 10; ANOVA). (J–R) Representative fluorescent images of Tg(fli1a:EGFP)y1 embryos at 2-dpf. (J,M) Image of trunk regions taken at 2-dpf, with the vascular structures visualized by eGFP fluorescence and labeled ISV and DLAV showed regular development in the embryo injected with control MO. The boxed regions are shown at higher magnification in the bottom panels. (K,L,N,O) Compared with control MO, embryos injected with nxhl-MO present a lower number of incomplete ISVs and thinner ISVs (N,O, yellow arrows) and ectopic sprouts (asterisk) of dorsal aorta. In control embryos, the parachordal vessels (PAV) form normally (M, red arrows). Compared with control, MO knock down nxhl prevents the parachordal vessels (PAV) formation, the precursor to the lymphatic system. In control embryos, caudal vein plexus (CVP) were formed honeycomb-like structures at the tail around 2-dpf (P, white arrows). In contrast, nxhl knock down resulted in specific defects in caudal vein plexus (CVP) formation (Q,R). (S–U) Quantification of the mean diameter ISVs (S,T) and loop formation at CVP (U) shows significantly decrease in nxhl morphants. Columns, mean; SEM (n = 10; ANOVA) ***p < 0.0001. DLAV, dorsal longitudinal anastomotic vessels; ISV, intersegmental vessel; DA, dorsal aorta; PCV, posterior cardinal vein; CVP, caudal vein plexus; CA, caudal artery; CV, caudal vein; dpf, days post fertilization. Scale bar, 100 μm. |

Nxhl affects angiogenic phenotypes in vitro. (A) Silence of nxhl (homolog of Harbi1) gene suppresses HUVEC cell migration and invasion. Representative images of migrated and invasive cells stained with crystal violet and inhibition of migration in nxhl-siRNA treated HUVEC cells. The migration and invasive potential of HUVECs treated with nxhl-siRNA was determined using transwell chambers as described in the “Materials and methods” section. (B) Silence of nxhl gene suppresses HUVEC and HCC cell tube formation abilities. Representative images of tube formation in nxhl-siRNA treated HUVEC cells and inhibition of tube formation in vitro (up row). Images were taken 6 h after addition of the supernatant. Tube networks were quantified using the Image J software and expressed as branches. Scale bars, 50 μm (middle row). Representative images of tube formation in nxhl-siRNA treated HCC cells (down row). Scale bars, 100 μm. Images were taken 24 h after addition of the supernatant. Tube networks were quantified using the Image J software and expressed as branches. The data represent as mean ± SEM from three independent experiments. *p < 0.05, **p < 0.001, and ***p < 0.0001 represents statistically significant. |
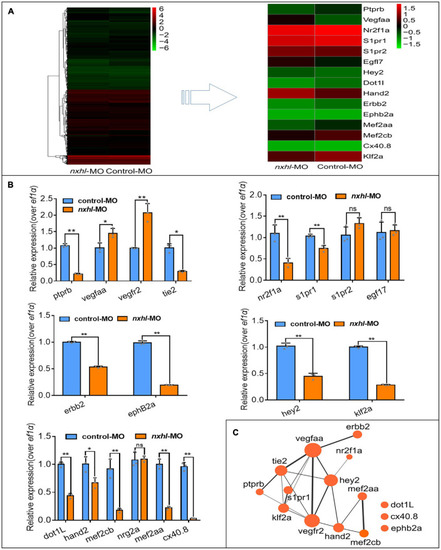
Nxhl modulates ptprb expression and angiogenic networks. (A) Heatmap of the 15 selected genes from zebrafishes after injection of 4 ng nxhle1i1 MO at 3-dpf examined by RNA-seq. (B) Expression of genes associated with angiogenesis and/or heart development post injection of nxhle1i1 MO 3-dpf using qPCR. The data above represent as mean ± SEM from three independent experiments. Ns, non-significant, *p < 0.05, **p < 0.001 represents statistically significant. (C) Networks of the genes previously reported to be associated with angiogenesis and heart development. Cytoscope V3.6.1 was used to build this network. |

Loss of ptprb phenocopies nxhl deficiency. (A–F) Gross morphology at 2- and 3-dpf. Compared with control zebrafish, ptprb knock-down causes pericardial oedema (B,C,E,F, red arrowheads) and circulation defects. Heart beat and circulation in caudal vein (CV) is visible in the control fish, but is abnormal in ptprb morphants (Supplementary Videos 3–8). (G) A time-course plot of percent survival in control vs. ptprb morphants for 3 days. (H) shows the percentage of embryos with development defects. (I) Quantification of the pericardial area of embryos. Error bars, mean ± SEM; ***p < 0.0001 (n = 10; ANOVA). (J–R) Representative fluorescent images of Tg(fli1a:EGFP)y1 embryos at 2-dpf. (J,M) Image of trunk regions taken at 2-dpf, with the vascular structures visualized by eGFP fluorescence and labeled ISV and DLAV showed regular development in the embryo injected with control MO. The boxed regions are shown at higher magnification in the bottom panels. (K,L,N,O) Compared with control MO, embryos injected with ptprb-MO present thinner ISVs (N,O, yellow arrows). In control embryos, the parachordal vessels (PAV) form normally (M, red arrows). Compared with control, MO knock down ptprb prevents the parachordal vessels (PAV) formation, the precursor to the lymphatic system. In control embryos, caudal vein plexus (CVP) were formed honeycomb-like structures at the tail around 2-dpf (P, white arrows). In contrast, ptprb knock down resulted in specific defects in caudal vein plexus (CVP) formation (Q,R). (S–U) Quantification of the mean diameter ISVs (S,T) and loop formation at CVP (U) shows significantly decrease in ptprb morphants. Columns, mean; SEM (n = 10; ANOVA) ***p < 0.0001. DLAV, dorsal longitudinal anastomotic vessels; ISV, intersegmental vessel; CVP, caudal vein plexus; CA, caudal artery; CV, caudal vein; dpf, days post fertilization. Scale bar, 100 μm. (V) Expression of genes associated with angiogenesis (left) and heart development (right) post injection of ptprb MO 2-dpf using qPCR. The data represent as mean ± SEM from three independent experiments. *p < 0.05, **p < 0.001 represents statistically significant. |

Nxhl regulates VE-PTP (ptprb) through interactions with NCL. (A) ChIRP-MS identification of nxhl RNA binding proteins using zebrafish tissues. qPCR identification of nxhl RNA in the eluted RNAs. Graph shows more than 90% nxhl RNA was retrieved, and no GAPDH was detected. Heat map shows major proteins are enriched and significantly (change fold > 2 and p < 0.05) retrieved by nxhl and control probes, analyzed by LC/MS-MS. NCL protein (purple boxed) was selected as candidate for follow-up study. The Centroid of NCL protein shows that NCL protein is pulled down and identified by LC/MS-MS. The specific peptide identifies NCL protein. (B) The interaction between nxhl, VE-PTP mRNA and NCL protein by RIP-qPCR assay. The mRNA expression of nxhl was determined by qPCR and Western blotting against Flag antibody and used to identify the successful expression of pcDNA3.1- Flag-nxhl plasmid in 293T cells. Bars show the interaction between nxhl mRNA and NCL protein. The interaction between VE-PTP mRNA and NCL protein is shown too, and qPCR shows the detection for VE-PTP mRNA expression in the NCL-pulled down RNA. (C) The interaction between nxhl, VE-PTP mRNA and NCL protein by pull down assay. Gels show the interaction between VE-PTP mRNA and NCL protein. Western blotting was performed to detect NCL protein in the VE-PTP-biotin probe -pulled down proteins in 293T cells. The interaction between ptprb mRNA and NCL protein is shown too. (D) Loss of nxhl affects the expression of NCL at both mRNA and protein levels. The mRNA expression of NCL and ptprb were determined by qPCR. The total NCL protein, total nxhl and ptprb protein in zebrafish tissues from knock-down group and control were detected by Western blotting using specific antibodies (details see Materials and methods). β-actin was used as internal control. (E) Silence of NCL inhibits angiogenesis and expression of VE-PTP. The tube formation and cell migration potential of HUVECs treated with NCL-siRNA was determined by using transwell chambers as described in the “Materials and methods” section. Scale bars, 20 μm. Representative images of cells stained in NCL-siRNA treated HUVEC cells. The expression of NCL and VE-PTP was quantified by qPCR. Protein levels of NCL and VE-PTP were examined by using Western blotting post silence of NCL. GAPDH antibody was used as internal control. The data represent as mean ± SEM from three independent experiments. *p < 0.05, **p < 0.001, ***p < 0.0001 represents statistically significant. |

Nxhl attenuates tumor invasion and proteins associated with angiogenesis and EMT. (A) Silence of nxhl (homolog of Harbi1) inhibits migration and EMT of HCC cells. Representative images of migrated cells stained with crystal violet and inhibition of migration in nxhl-siRNA treated HepG2 cell (up row). Representative images of colony formation cells stained with crystal violet and inhibition of colony forming in nxhl-siRNA treated HepG2 cell (down row). (B) Silence of nxhl inhibits epithelial-mesenchymal transition of HepG2 cells. Four EMT marker proteins, NCL, NCL T76 and VE-PTP were detected using Western blotting method in control and siRNA-treated HepG2 cells. (C) nxhl (Harbi1) expression in 72 HCC tissues and para-cancer tissues. qPCR was used to determine the human homolog of nxhl (Harbi1) expression levels. The data above represent as mean ± SEM from three independent experiments. *p < 0.05, **p < 0.001 represents statistically significant. |

Nxhl controls angiogenesis by targeting VE-PTP (ptprb)-related angiogenic genes. (A) Schematic model illustrating the mechanism of nxhl in zebrafish angiogenesis and heart development. The interactions between nxhl mRNA and NCL protein, NCL protein and ptprb mRNA are new-found interactions in this study. It connects with the keystone network of angiogenesis and heart development. (B) Possible mechanism of nxhl in zebrafish angiogenesis and heart development. Knockdown of nxhl may downregulate the nxhl-NCL-ptprb complex, subsequently regulate the proteins associated with angiogenesis and heart development, and finally result in heart pericardial edema, vascular patterning and integrity defects. |