FIGURE SUMMARY
Title

The H3K27 demethylase controls the lateral line embryogenesis of zebrafish

Authors
Tang, D., Lu, Y., Zuo, N., Yan, R., Wu, C., Wu, L., Liu, S., He, Y.
Source
Full text @ Cell Biol. Toxicol.

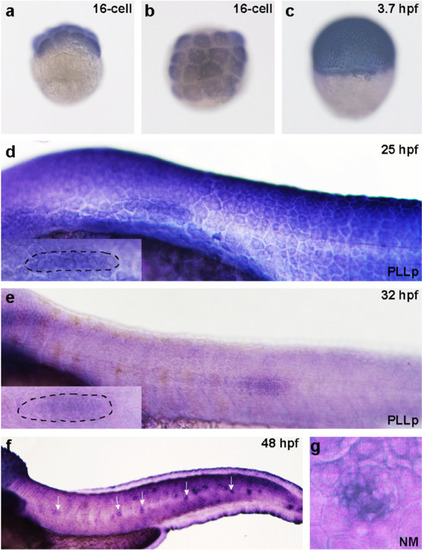
The expression pattern of kdm6bb during the early development stage of zebrafish. a, bKdm6bb is detected at the early embryonic stage at 16-cell from the lateral and top view (a, b; n = 14 embryos) and blastula period (3.7 hpf) (c; n = 12 embryos) by whole-mount in situ hybridization. d–fKdm6bb is expressed in the migrating primordium (d, e) and deposited neuromasts (f). The dotted lines of (d; n = 8 embryos) and (e; n = 10 embryos) outline the migrating primordia at higher magnification. White arrows in (f;n = 16 embryos) mark the neuromasts stained with kdm6bb along the trunk. The details of kdm6bb staining in magnified neuromasts are presented in (g). The experiment was duplicated for two times

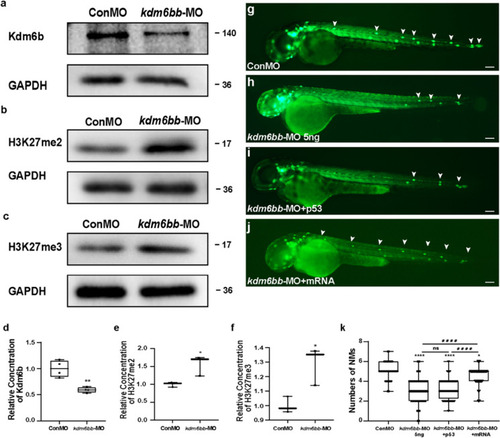
Kdm6b is required for cell migration and neuromast deposition in zebrafish posterior lateral lines. a–f Kdm6b level is effectively downregulated using the morpholino technology. The protein blotting of Kdm6b is significantly decreased (a), and the protein blottings of H3K27me2 (b) and H3k27me3 (c) were both upregulated by the special antisense morpholino injection both in the band intensity. d–f The quantification analysis of relative concentration of Kdm6b, H3K27me2, and H3K27me3. Data are recorded as mean (minimum and maximum values). *p < 0.05 and **p < 0.01. g–j At 48 hpf, the deposited neuromasts are labeled in green along the posterior body of control embryos (g), Kdm6b-deficient mutants (h), co-injection of kdm6bb-MO + p53 (i), and co-injection of kdm6bb-MO + kdm6bb mRNA specimens (j). The neuromasts of PLL are labeled in green fluorescence in the transgenic cldnb:lynGFP embryos, and a severe reduction in number of neuromasts is found (g–h). The decreased number of neuromasts was confirmed when co-injected with p53 and kdm6bb-MO (i). The decreased number of neuromasts by Kdm6b-defect is partially rescued by the combined injection of kdm6bb mRNA (j). White arrowheads label the neuromast along the trunk and terminal of the posterior LL (g–j). k Statistical analysis of the number of posterior LL neuromasts at 48 hpf in controls (n = 185), Kdm6b-deficient embryos (n = 129), and kdm6bb-MO + mRNA members (n = 42). ****p < 0.0001 (the contrast between kdm6bb-MO group with Con-MO group), ####p < 0.0001 (the contrast between kdm6bb-MO group with kdm6bb-MO + mRNA group), *p < 0.05 (the contrast between kdm6bb-MO + mRNA group with Con-MO group). Scale bars mark a distance of 100 μm

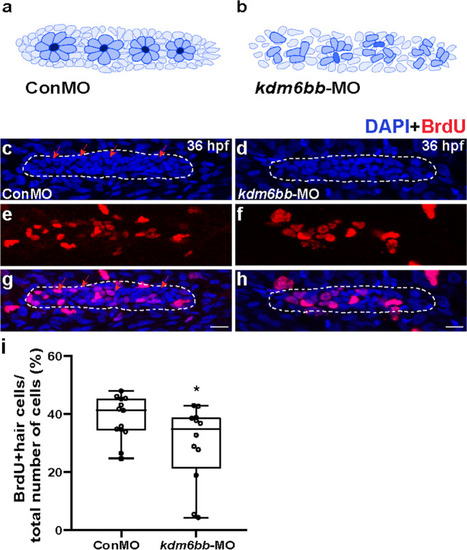
The downregulation of Kdm6b represses cell proliferation and disrupts rosette assembly during primordium migration. a, b The diagram of rosette organization in controls and kdm6bb-MO embryos. c–h Representative images show the comparison in number of BrdU labeled proliferating cells between controls embryos (c, e, g) and Kdm6b-deficient mutants (d, f, h) at 36 hpf. Red arrows indicate the rosette-shaped clusters of the primordium (c). Scale bars mark the 10 μm scale. i Significant difference in quantification of BrdU index in control embryos and kdm6bb-MO embryos. Data are recorded as mean (minimum and maximum values). *p < 0.05

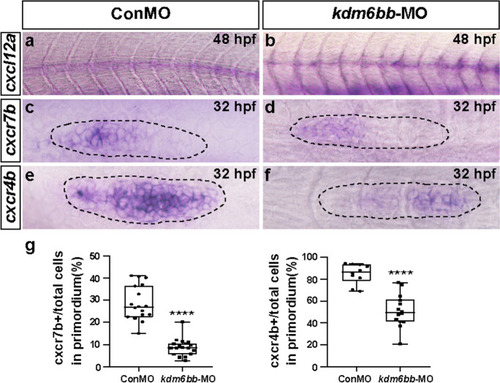
The chemokine signaling pathway is disrupted by kdm6bb-MO. a–f Representative in situ staining of chemokine members cxcl12a, cxcr4b, and cxcr7b are compared between the controls and kdm6bb morphants at 32–48 hpf. (a, b)The consecutive expression of cxcl12a is interrupted in Kdm6b knockdown embryos, both (c, d) cxcr4b and (e, f) cxcr7b expressions are downregulated in kdm6bb morpholino mutants in comparison with the control-MO-injected embryos. g The ratio of cxcr7b and cxcr4b-positive cells to total cells in the primordia of controls (ConMO; n = 18 embryos for cxcr7b, and n = 10 embryos for cxcr4b) and experiment group (kdm6bb-MO; n = 19 embryos for cxcr7b, and n = 14 embryos for cxcr4b). The black dotted lines outline the primordium appearance. The leading region is positioned to the right and the trailing region is to the left. Data are recorded as mean (minimum and maximum values). ****p < 0.0001

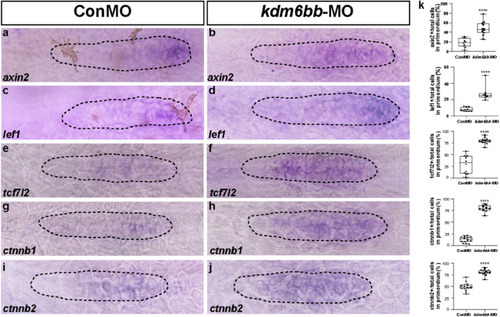
Knockdown of Kdm6b upregulates the Wnt signaling pathway. a–j In situ staining of the Wnt signaling target genes, axin2, lef1, tcf7l2, ctnnb1, and ctnnb2 are all upregulated in kdm6bb-MO embryos compared to the controls by in situ hybridization at 32 hpf. k The ratio of axin2, lef1, tcf7l2, ctnnb1, and ctnnb2-positive cells to total cells in the primordia of controls (ConMO; n = 10 embryos for axin2 and lef1, respectively; n = 12, 15, and 15 embryos for tcf7l2, ctnnb1, and ctnnb2, respectively) and experiment group (kdm6bb-MO; n = 12 embryos for axin2, n = 8 embryos for lef1, n = 15 embryos for tcf7l2, n = 12 embryos for ctnnb1, and n = 14 embryos for ctnnb2).The black dotted lines are drawn to shape the primordium. Data are recorded as mean (minimum and maximum values). ****p < 0.0001

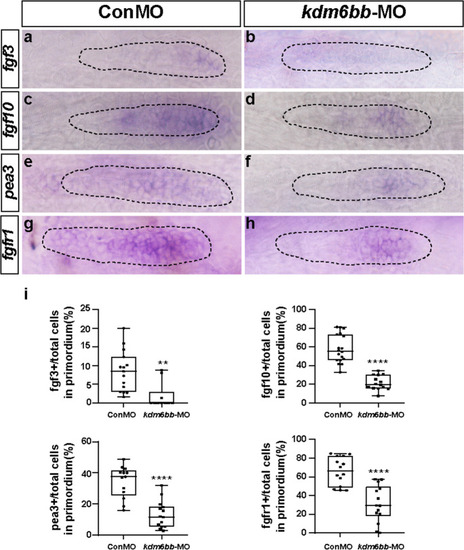
Kdm6b-depletion represses Fgf signaling in zebrafish primordium. a–h Corresponding decreased expression of Fgf signaling components including fgf3, fgf10, pea3, and fgfr1 are presented in kdm6bb morphants compared to the control siblings at 32 hpf. i The ratio of fgf3, fgf10, pea3, and fgfr1-positive cells to total cells in the primordia of controls (ConMO; n = 15 embryos for fgf3, n = 18 embryos for fgf10, n = 13 embryos for pea3, and n = 14 embryos for fgfr1) and experiment group (kdm6bb-MO; n = 10 embryos for fgf3, n = 14 embryos for fgf10, n = 14 embryos for pea3, and n = 14 embryos for fgfr1).The primordium appearance is shaped by dotted lines. Data are recorded as mean (minimum and maximum values). **p < 0.01, and ****p < 0.0001

Acknowledgments
This image is the copyrighted work of the attributed author or publisher, and ZFIN has permission only to display this image to its users. Additional permissions should be obtained from the applicable author or publisher of the image. Full text @ Cell Biol. Toxicol.