IMAGE

Fig. 3

ID
ZDB-IMAGE-230814-125
Source
Figures for Tang et al., 2021
Image
Figure Caption

Fig. 3

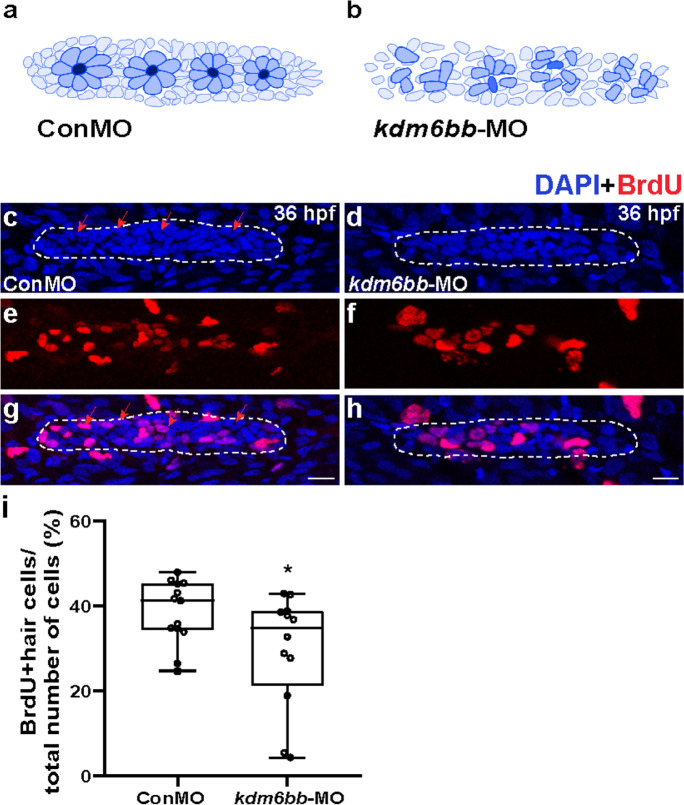
The downregulation of Kdm6b represses cell proliferation and disrupts rosette assembly during primordium migration. a, b The diagram of rosette organization in controls and kdm6bb-MO embryos. c–h Representative images show the comparison in number of BrdU labeled proliferating cells between controls embryos (c, e, g) and Kdm6b-deficient mutants (d, f, h) at 36 hpf. Red arrows indicate the rosette-shaped clusters of the primordium (c). Scale bars mark the 10 μm scale. i Significant difference in quantification of BrdU index in control embryos and kdm6bb-MO embryos. Data are recorded as mean (minimum and maximum values). *p < 0.05

Acknowledgments
This image is the copyrighted work of the attributed author or publisher, and ZFIN has permission only to display this image to its users. Additional permissions should be obtained from the applicable author or publisher of the image. Full text @ Cell Biol. Toxicol.