
- Title
-
Characterization of the Zebrafish Cell Landscape at Single-Cell Resolution
- Authors
- Jiang, M., Xiao, Y., E, W., Ma, L., Wang, J., Chen, H., Gao, C., Liao, Y., Guo, Q., Peng, J., Han, X., Guo, G.
- Source
- Full text @ Front Cell Dev Biol
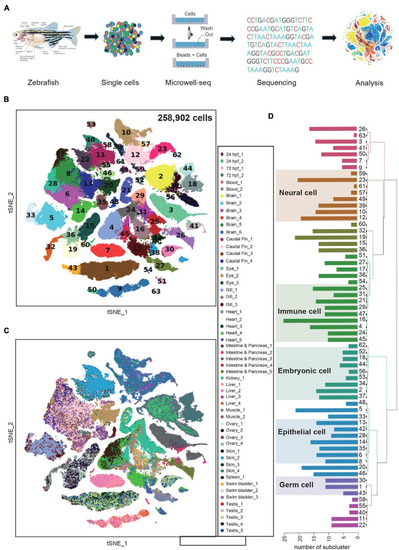
Constructing a zebrafish cell landscape using microwell-seq. (A) A schematic of the basic workflow for zebrafish cell landscape. Zebrafish tissues were analyzed. After dissociation, single cells were captured in single microwells. Cells were lysed, transcriptomes amplified and sequenced, reads mapped, and data analyzed. (B) t-distributed stochastic neighbor embedding (t-SNE) analysis of >250,000 single cells sampled from zebrafish embryo and adult tissues. In the t-SNE map, 63 main cell type clusters are labeled by different colors. Cell cluster markers are listed in Supplementary Table 1. (C) t-SNE analysis of >250,000 single cells sampled from zebrafish tissues. Tissue types and batches are labeled by different colors in the t-SNE map. hpf, hours post-fertilization. (D) Dendrogram showing relationships among 63 cell types. The bar chart on the left represents the number of sub-clusters contained in each main cluster. A total of 633 sub-clusters were obtained from 63 main clusters. |
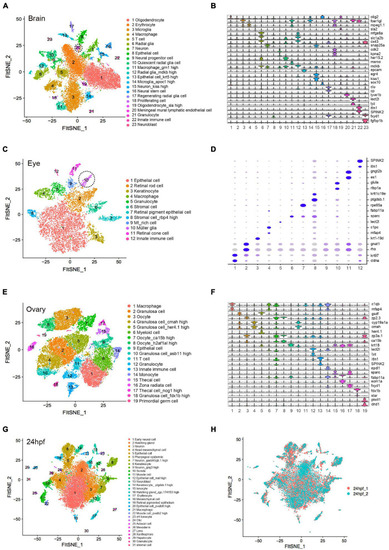
Cellular heterogeneity in embryo and adult tissues. (A) t-SNE map of zebrafish brain single-cell data. Cells are colored by cell-type cluster. (B) Violin plot showing representative gene expression in each cluster of zebrafish brain. (C) t-SNE map of zebrafish eye single-cell data. Cells are colored by cell-type cluster. (D) Dot plot showing representative gene expression in each cluster of zebrafish eye. (E) t-SNE map of zebrafish ovary single-cell data. Cells are colored by cell-type cluster. (F) Violin plot showing representative gene expression in each cluster of zebrafish ovary. (G) t-SNE map of zebrafish embryo (24 hpf) single-cell data. Cells are colored by cell-type cluster. (H) t-SNE map of zebrafish embryo (24 hpf) single-cell data. Cells are colored by different batches. hpf, hours post-fertilization. |

Cross-species analysis of cell-type similarity. (A) t-SNE map of zebrafish gill single-cell data. Cells are colored by cell-type cluster. (B) t-SNE map of zebrafish swim bladder single-cell data. Cells are colored by cell-type cluster. (C) Comparative transcriptome analysis of cell similarity between zebrafish gill, swim bladder and mouse lung. Red corresponds to a high correlation; blue and white correspond to low correlation. (D) Comparative transcriptome analysis of cell similarity between gill ionocytes and mouse lung epithelial cells. Zoom-in view of the region highlighted by a solid line in (C). Red corresponds to a high correlation; blue and white correspond to low correlation. Z_SB, zebrafish swim bladder; Z_G, zebrafish gill; M_AL, mouse adult lung; M_FL, mouse fetal lung. (E) A cell–cell correlation network between zebrafish stromal cell and human, mouse fetal, neonatal, adult stromal cells. Thick lines indicate high correlation; thin lines indicate low correlation. H, human; M, mouse; Z, zebrafish. (F) Hierarchical clustering identified correlation of human, mouse and zebrafish stromal cells. |
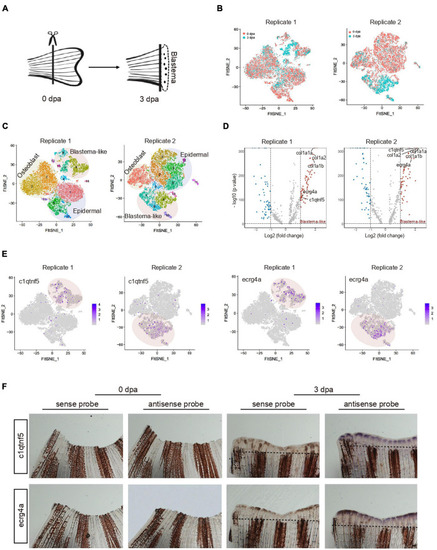
Characteristic of blastema cells during caudal fin regeneration. (A) A schematic of amputated primary caudal fin and blastema formed after 3 days. (B) t-SNE map of zebrafish caudal fin regeneration single-cell data from two independent biological replicates termed Replicate 1 (left) and Replicate 2 (right). Cells are colored by 0 and 3 dpa. (C) t-SNE map of zebrafish caudal fin regeneration single-cell data from Replicate 1 (left) and Replicate 2 (right). Cells are colored by cell-type cluster. (D) Volcano plot showing differentially expressed genes in blastema cells from Replicate 1 (left) and Replicate 2 (right). (E) Feature plot showing high expression of c1qtnf5 and ecrg4a in caudal fin regeneration single-cell dataset from Replicate 1 and Replicate 2. (F) Whole mount in situ hybridization against marker genes with sense and antisense probe in caudal fin at 0 and 3 dpa. Dashed lines indicate the amputation planes. n = 3 independent experiments. dpa, days post-amputation. scale bars, 200 μm. EXPRESSION / LABELING:
|
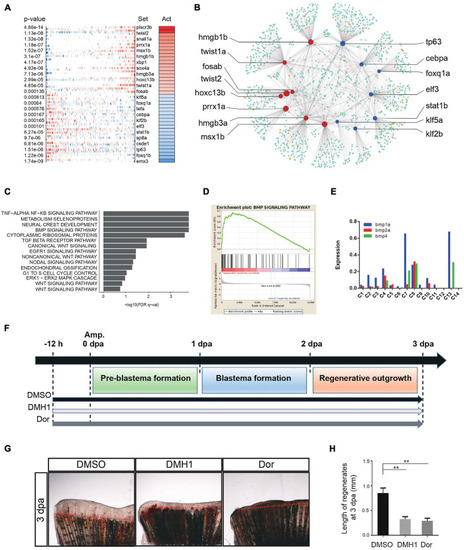
Genetic regulation during tissue regeneration. (A) Virtual inference of protein-activity by enriched regulon analysis in caudal fin Replicate 1. Red represents activated transcription factors; blue indicates repressed transcription factors. Act, activation. (B) A gene-gene correlation network of regeneration module. Red corresponds to high activation transcription factors; blue corresponds to low activation transcription factors; orange corresponds to co-factor genes; green corresponds to targeted genes. (C) Gene set enrichment analysis of caudal fin regeneration module in Replicate 1. (D) Gene set enrichment analysis between caudal fin regeneration module and non-regeneration module in Replicate 1. (E) Histogram showing BMP signaling pathway-related gene expression of each subgroup in caudal fin regeneration from Replicate 1. (F) Scheme of DMH1 and dorsomorphin treatment from –12 h to 3 dpa. dpa, days post-amputation. (G,H) DMH1 and dorsomorphin (Dor) treatment both significantly inhibited fin regeneration from –12 h to 3 dpa (pre-blastema formation, blastema formation, and regenerative outgrowth stages), when compared to DMSO treatment. Red dashed lines indicate the amputation planes. **p < 0.01 by Student’s t-test. Error bars represent the standard error of 4 independent experiments. dpa, days post-amputation; scale bars, 500 μm in (G). |

ZFIN is incorporating published figure images and captions as part of an ongoing project. Figures from some publications have not yet been curated, or are not available for display because of copyright restrictions. EXPRESSION / LABELING:
|