
FIGURE 5
- ID
- ZDB-FIG-211025-190
- Publication
- Jiang et al., 2021 - Characterization of the Zebrafish Cell Landscape at Single-Cell Resolution
- Other Figures
- All Figure Page
- Back to All Figure Page
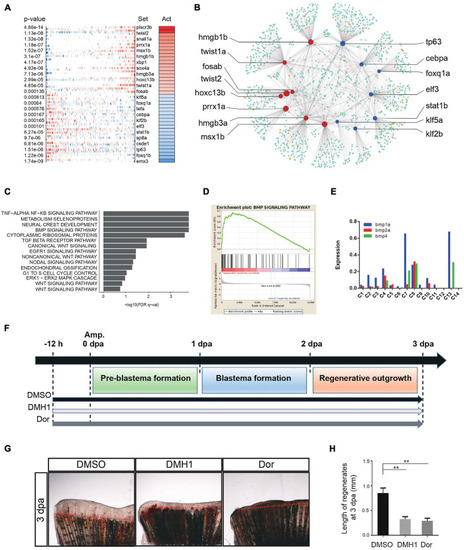
Genetic regulation during tissue regeneration. (A) Virtual inference of protein-activity by enriched regulon analysis in caudal fin Replicate 1. Red represents activated transcription factors; blue indicates repressed transcription factors. Act, activation. (B) A gene-gene correlation network of regeneration module. Red corresponds to high activation transcription factors; blue corresponds to low activation transcription factors; orange corresponds to co-factor genes; green corresponds to targeted genes. (C) Gene set enrichment analysis of caudal fin regeneration module in Replicate 1. (D) Gene set enrichment analysis between caudal fin regeneration module and non-regeneration module in Replicate 1. (E) Histogram showing BMP signaling pathway-related gene expression of each subgroup in caudal fin regeneration from Replicate 1. (F) Scheme of DMH1 and dorsomorphin treatment from –12 h to 3 dpa. dpa, days post-amputation. (G,H) DMH1 and dorsomorphin (Dor) treatment both significantly inhibited fin regeneration from –12 h to 3 dpa (pre-blastema formation, blastema formation, and regenerative outgrowth stages), when compared to DMSO treatment. Red dashed lines indicate the amputation planes. **p < 0.01 by Student’s t-test. Error bars represent the standard error of 4 independent experiments. dpa, days post-amputation; scale bars, 500 μm in (G). |