
FIGURE 1
- ID
- ZDB-FIG-211025-186
- Publication
- Jiang et al., 2021 - Characterization of the Zebrafish Cell Landscape at Single-Cell Resolution
- Other Figures
- All Figure Page
- Back to All Figure Page
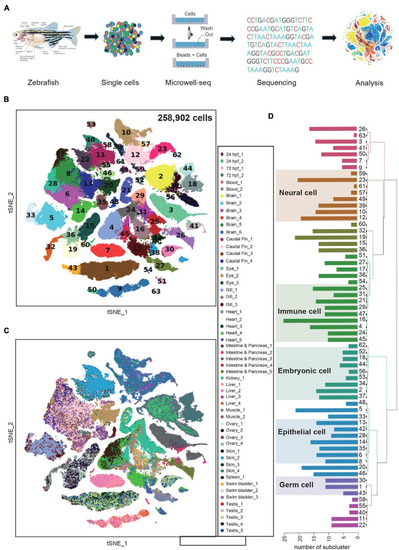
Constructing a zebrafish cell landscape using microwell-seq. (A) A schematic of the basic workflow for zebrafish cell landscape. Zebrafish tissues were analyzed. After dissociation, single cells were captured in single microwells. Cells were lysed, transcriptomes amplified and sequenced, reads mapped, and data analyzed. (B) t-distributed stochastic neighbor embedding (t-SNE) analysis of >250,000 single cells sampled from zebrafish embryo and adult tissues. In the t-SNE map, 63 main cell type clusters are labeled by different colors. Cell cluster markers are listed in Supplementary Table 1. (C) t-SNE analysis of >250,000 single cells sampled from zebrafish tissues. Tissue types and batches are labeled by different colors in the t-SNE map. hpf, hours post-fertilization. (D) Dendrogram showing relationships among 63 cell types. The bar chart on the left represents the number of sub-clusters contained in each main cluster. A total of 633 sub-clusters were obtained from 63 main clusters. |