- Title
-
SPRED2 loss-of-function causes a recessive Noonan syndrome-like phenotype
- Authors
- Motta, M., Fasano, G., Gredy, S., Brinkmann, J., Bonnard, A.A., Simsek-Kiper, P.O., Gulec, E.Y., Essaddam, L., Utine, G.E., Guarnetti Prandi, I., Venditti, M., Pantaleoni, F., Radio, F.C., Ciolfi, A., Petrini, S., Consoli, F., Vignal, C., Hepbasli, D., Ullrich, M., de Boer, E., Vissers, L.E.L.M., Gritli, S., Rossi, C., De Luca, A., Ben Becher, S., Gelb, B.D., Dallapiccola, B., Lauri, A., Chillemi, G., Schuh, K., Cavé, H., Zenker, M., Tartaglia, M.
- Source
- Full text @ Am. J. Hum. Genet.
|
Clinical features and pedigrees of the subjects with bi-allelic inactivating SPRED2 variants (A) Facial features of the four individuals included in this study. Note the occurrence of bitemporal narrowing, hypertelorism, down-slanting palpebral fissures, ptosis, low-set/posteriorly rotated ears with evident antitragus, wide nasal bridge, and low posterior hairline with a webbed/short neck. Typical NS chest anomalies (superior pectus carinatum and inferior pectus excavatum) are also evident. Craniofacial features resemble NS. The NS facial gestalt is particularly represented in subject 2-II-1. (B) Pedigree charts of the three families with bi-allelic inactivating SPRED2 variants. All probands were born from first cousins. Note the high inbreeding of family 1. |
|
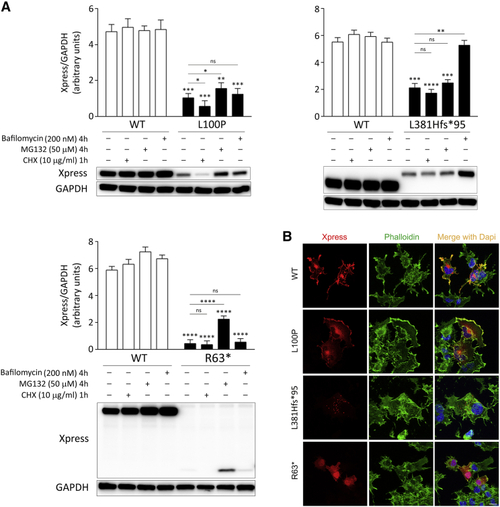
Biochemical characterization of the RASopathy-causing SPRED2 proteins (A) Accelerated degradation of the SPRED2Arg63∗ (R63∗), SPRED2Leu100Pro (L100P), and SPRED2Leu381Hisfs∗95 (L381Hfs∗95) proteins. WB analysis shows WT and variant Xpress-tagged SPRED2 protein levels in transfected COS-1 cells, basally and after CHX (10 μg/mL), MG132 (50 μM), or bafilomycin A1 (200 nM) treatment. As shown, accelerated degradation of SPRED2Arg63∗ mainly occurs via the proteasome, while SPRED2Leu381Hisfs∗95 is degraded primarily via autophagy/lysosomes. Both pathways are involved in the accelerated degradation of SPRED2Leu100Pro, with a more relevant role of the proteasome (slight but statistically significant increased protein level in cells treated with MG132). GAPDH was used as loading control. Representative blots (below) and mean ± SD densitometry values (above) of three independent experiments are shown. Asterisks indicate statistically significant differences (∗p < 0.05, ∗∗p < 0.005, ∗∗∗p < 0.001, ∗∗∗∗p < 0.0001, ns indicates not significant; two-way ANOVA followed by Sidak’s multiple comparison test). (B) Subcellular localization of transiently expressed Xpress-tagged WT or mutated SPRED2 proteins in COS-1 cells under steady-state conditions revealed by confocal microscopy analysis. Cells were stained using an anti-Xpress monoclonal antibody and Alexa Fluor 594 goat anti-mouse secondary antibody (red). The F-actin dye Alexa Fluor 488 phalloidin (green) was used to stain the cortical actin associated with the plasma membrane. Merged images with nuclei (DAPI staining, blue) are displayed on the right panels. Scale bar, 10 μm. |
|
Structural impact of the p.Leu100Pro substitution in SPRED2 (A) The crystallographic complex of neurofibromin (NF1) GRD (GAPc, magenta) with the EVH1 domain of SPRED1 (blue) and GTP-bound KRAS (gray) is shown. The N- and C-terminal GAPex stretches encompassing GAPc are shown in green. The lateral chain of Leu101 (L101) (corresponding to Leu100 in SPRED2) is shown (orange). (B) Surface visualization (Gaussian density surface) of the hydrophobic residues close to Leu101 (i.e., Ala19, Val21, Val42, Trp92, Phe103, and Phe112) is shown in yellow. Lateral chains of Leu101 and adjacent residues, Gly100 (G100) and Thr102 (T102), mutated in LGSS, are shown. (C) Enlarged view of the neurofibromin and SPRED1 interacting surfaces. Relevant residues are indicated using the single-letter amino acid code. Lateral chains of SPRED1 residues (Arg24, Gly30, Trp31, Val44, Gly62, Thr88, Trp92, Gly100, and Thr102) mutated in LGSS are shown (yellow), together with Leu101 (orange). Of note, Thr102 interacts with both GAPc (Leu1252) and GAPex (Met1215). |
|
p.Leu100Pro results in a defective SPRED2 binding to neurofibromin (A) Subcellular localization of transiently expressed V5-tagged GRD and Xpress-tagged WT or SPRED2Leu100Pro (L100P) proteins in COS-1 cells after stimulation with EGF (30 ng/mL, 5 min) revealed by confocal microscopy analysis. Cells were stained using anti-Xpress IgG1 and anti-V5 IgG2a monoclonal antibodies and revealed by goat anti-mouse IgG1 Alexa Fluor 647 (pseudocolored in green) and goat anti-mouse IgG2a Alexa Fluor 594 (red) secondary antibodies, respectively. Nuclei are visualized by DAPI staining (blue). Scale bar, 10 μm. (B) Co-immunoprecipitation assays. Lysates from HEK293T cells transiently transfected to express WT or variant Xpress-tagged SPRED2 protein were serum-starved, stimulated with EGF (30 ng/mL), and immunoprecipitated with an anti-Xpress antibody and assayed by western blotting using the indicated antibodies. |
|
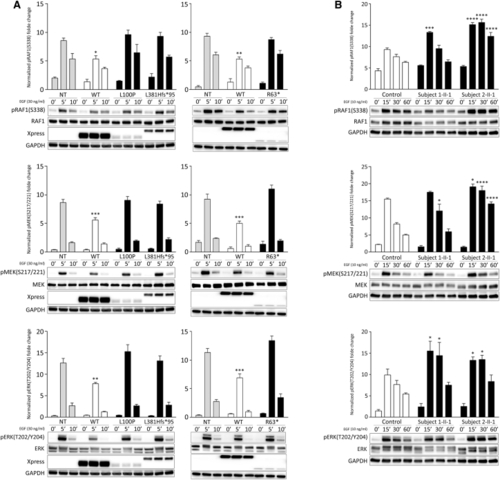
Impact of SPRED2 mutations on MAPK signaling (A) Overexpression of the RASopathy-causing SPRED2Arg63∗ (R63∗), SPRED2Leu100Pro (L100P), and SPRED2Leu381Hisfs∗95 (L381Hfs∗95) proteins in HEK293T cells do not significantly perturb RAF1, MEK, and ERK phosphorylation as assessed by time-course experiments. Of note, expression of WT SPRED2 down-modulates ERK phosphorylation. HEK293T cells were transiently transfected with the indicated Xpress-tagged SPRED2 constructs, serum-starved and treated with 30 ng/mL EGF for 5 or 10 min, or left unstimulated. Equal amounts of cell lysates were resolved on 10% polyacrylamide gel. Representative blots (below) and mean ± SD densitometry values (above) of three independent experiments are shown. Asterisks indicate statistically significant differences compared with control cells (NT, mock transfection) at the corresponding time upon EGF stimulation (∗p < 0.05; ∗∗p < 0.005; ∗∗∗p < 0.001; two-way ANOVA followed by Tukey’s multiple comparison test). (B) Primary fibroblasts from subjects 1-II-1 (p.Leu381Hisfs∗95) and 2-II-1 (p.Leu100Pro) show variably enhanced RAF1, MEK, and ERK phosphorylation levels compared to control cells. Fibroblasts were starved for 16 h and then stimulated with EGF (10 ng/mL), in time-course experiments, or left unstimulated. Equal amounts of cell lysates were resolved on 10% polyacrylamide gel. Representative blots (below) and graphs reporting mean ± SD densitometry values (above) of three independent experiments are shown. Asterisks indicate statistically significant differences in the phosphorylation levels compared to control cells at the corresponding experimental points (∗p < 0.05; ∗∗∗p < 0.001; ∗∗∗∗p < 0.0001; two-way ANOVA followed by Tukey’s multiple comparison test). |
|
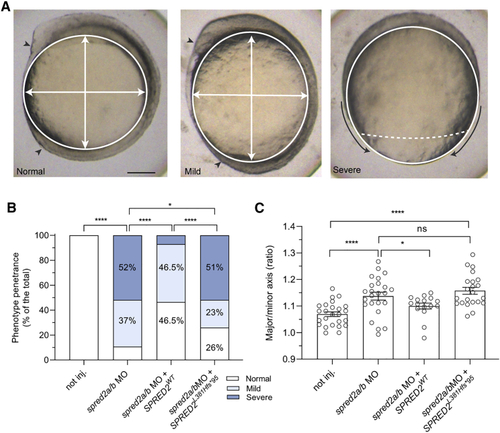
Consequences of MO-mediated Spred2 silencing on early zebrafish embryonic development (A) Phenotype classification (normal, mild, and severe) and quantification in embryos at around 11–12 hpf injected with antisense oligonucleotides (MO) (6 ng) against spred2a and spred2b with or without mRNA encoding WT SPRED2 (1.5 pg). Representative pictures for the different phenotypic classes are shown in the upper panel. Arrowheads indicate the head and tailbuds, black arrows show defective epiboly movements, white arrows indicate the major and minor axes. Scale bar: 125 μm. (B) Overall number of embryos (%) exhibiting the different phenotypes (not injected, n = 24; MO, n = 19; MO + WT SPRED2, n = 19; MO + SPRED2Leu381Hisfs∗95 [SPRED2L381Hfs∗95], n = 27). Two-tailed Fisher exact test was used to compare the prevalence of “normal” and “severe” phenotypic classes (∗p < 0.05, ∗∗∗∗p < 0.0001). (C) Quantification of the oval shape (major-to-minor axis ratio) (not injected, n = 25; MO, n = 26; MO + WT SPRED2, n = 16; MO + SPRED2Leu381Hisfs∗95 [SPRED2L381Hfs∗95], n = 22). Mean ± SEM is shown and one-way ANOVA with two-stage Benjamini, Krieger, and Yekutieli procedure was used for statistical assessment (∗p < 0.05, ∗∗∗∗p < 0.0001). PHENOTYPE:
|
|
Phenotypic assessment of Spred2 KO mice (A) Soft X-ray images showing skeletal abnormalities in a Spred2−/− (KO) mouse compared to an age-matched WT littermate. Arrow labels kyphosis. (B) X-ray images documenting scoliosis (arrow) in a KO mouse compared to an age-matched WT littermate. (C) Representative photograph of male littermates at the age of 6 weeks showing growth retardation of a KO mouse (left) compared to an age-matched control animal (right). (D) Comparison of the head shape of male littermates at the age of 6 months. (E) Quantification of skull lengths taken from X-ray images (n = 6, each group; ∗p < 0.05). (F) Representative photograph showing misaligned incisors in KO mice. (G) Examples of spleens of mice at the age of 12 months showing a dramatic increase in spleen size of a KO mouse. (H) Quantification of spleen to body weight ratios in young (6–8 weeks) and old (12 months) mice (n = 8 in each group; ∗p < 0.05). (I) Comparison of heart weight to body weight ratios (n = 6 mice in each group; ∗p < 0.05). (J) Examples of ventricular arrhythmias in KO mice at the age of 12 months. (K) Examples of supraventricular arrhythmias in KO mice at the age of 12 months. |

ZFIN is incorporating published figure images and captions as part of an ongoing project. Figures from some publications have not yet been curated, or are not available for display because of copyright restrictions. |

ZFIN is incorporating published figure images and captions as part of an ongoing project. Figures from some publications have not yet been curated, or are not available for display because of copyright restrictions. EXPRESSION / LABELING:
PHENOTYPE:
|


