
|
Fig. 6
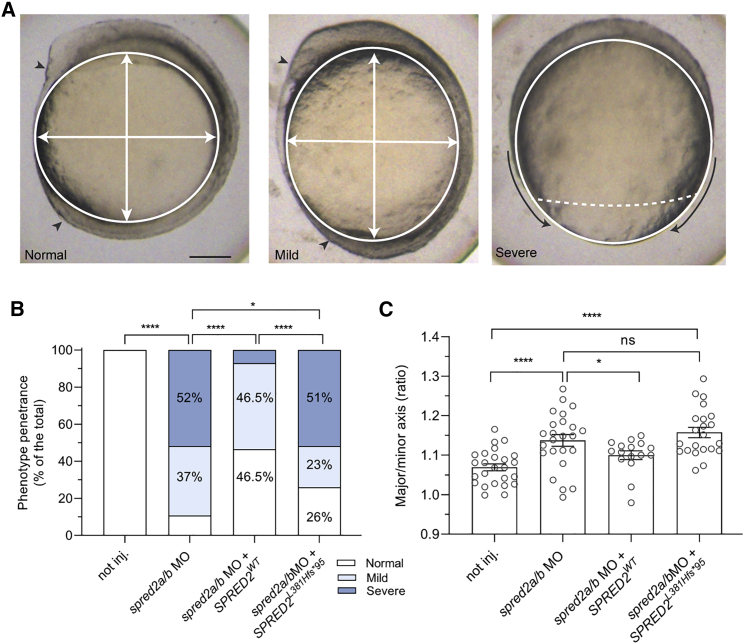
Consequences of MO-mediated Spred2 silencing on early zebrafish embryonic development
(A) Phenotype classification (normal, mild, and severe) and quantification in embryos at around 11–12 hpf injected with antisense oligonucleotides (MO) (6 ng) against spred2a and spred2b with or without mRNA encoding WT SPRED2 (1.5 pg). Representative pictures for the different phenotypic classes are shown in the upper panel. Arrowheads indicate the head and tailbuds, black arrows show defective epiboly movements, white arrows indicate the major and minor axes. Scale bar: 125 μm.
(B) Overall number of embryos (%) exhibiting the different phenotypes (not injected, n = 24; MO, n = 19; MO + WT SPRED2, n = 19; MO + SPRED2Leu381Hisfs∗95 [SPRED2L381Hfs∗95], n = 27). Two-tailed Fisher exact test was used to compare the prevalence of “normal” and “severe” phenotypic classes (∗p < 0.05, ∗∗∗∗p < 0.0001).
(C) Quantification of the oval shape (major-to-minor axis ratio) (not injected, n = 25; MO, n = 26; MO + WT SPRED2, n = 16; MO + SPRED2Leu381Hisfs∗95 [SPRED2L381Hfs∗95], n = 22). Mean ± SEM is shown and one-way ANOVA with two-stage Benjamini, Krieger, and Yekutieli procedure was used for statistical assessment (∗p < 0.05, ∗∗∗∗p < 0.0001).