
- Title
-
Preparation of Soluble Complex of Curcumin for the Potential Antagonistic Effects on Human Colorectal Adenocarcinoma Cells
- Authors
- Mohamed, J.M.M., Alqahtani, A., Khan, B.A., Al Fatease, A., Alqahtani, T., Venkatesan, K., Ahmad, F., Alzghoul, B.I., Alamri, A.
- Source
- Full text @ Pharmaceuticals (Basel)
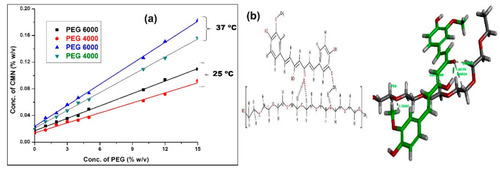
Figure 1. (a) Phase solubility curve of CMN in MilliQ water at 25 and 37 °C in the presence of PEG; (b) molecular modeling for the 1:1 complex of CMN: PEG; two and 3D illustrate the structures of enol form of CMN on the monomer displaying hydrophobic interaction of phenolic OH group. (Green tubes denote the monomer piece of CMN, and Grey tubes denote PEG; dotted lines indicating the most significant bonds, the distances are revealed in Å units).
|
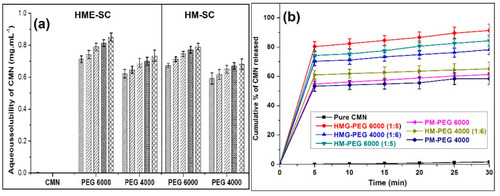
Figure 2. (a) Bar chart represents the solubility of CMN in HME and HM technology, and (b) dissolution release of curcumin from PM and HME and HM-SC (mean ± SD, n = 3). |
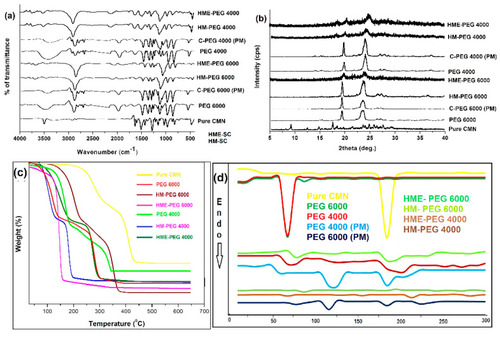
Figure 3. The FTIR spectrum (a), PXRD pattern (b), TGA curve (c), and (d) DSC thermogram of pure CMN, PMs, and SCs. |
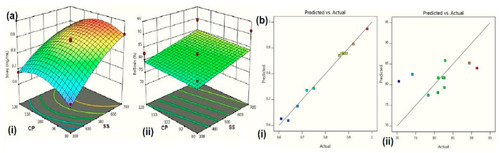
Figure 4. (a) 3D response surface from the CCD. (b) Plot of predicted versus actual response of (ai,bi) Solaq (mg.mL−1) and (aii,bii) Rel5min (%) results from HME-PEG 6000 SC.
|
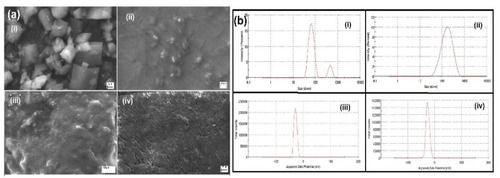
Figure 5. (a) SEM image of (ai) Pure CMN, (aii) PEG 6000, (aiii) HM-SC and, (aiv) HME-SC, and (b) DLS study; particle size of (bi) CMN-PM, (bii) CMN-SC, the zeta potential of (biii) HM-SC and (biv) HME-SC.
|
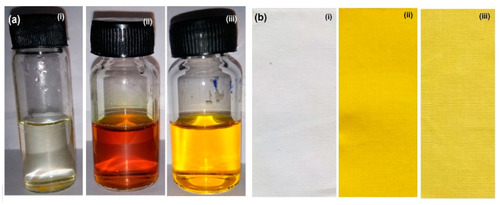
Figure 6. Photograph of (a) solution, (b) immersed cotton clothes of (i) pure CMN (ii) HME-SC, and (iii) HM-SC.
|
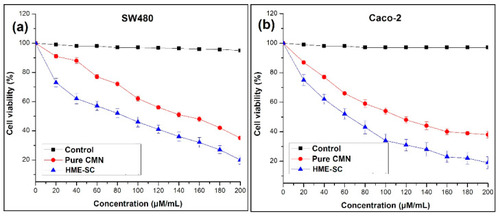
Figure 7. In vitro cytotoxic outcome of on (a) SW480 and (b) Caco-2 cell lines of control, pure CMN and HME-SC (mean ± SD, n = 3).
|
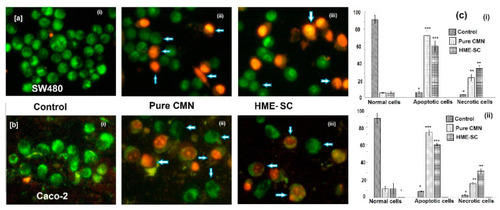
Figure 8. Apoptotic fluorescing image of AO/EB staining observed under fluorescent microscope with (a) SW480 and (b) Caco-2 cells; (i) control; (ii) pure CMN; and (iii) HME-SC and (c) % of live, apoptotic and necrotic cells after 24 h treatment (i) SW480 and (ii) Caco-2 cells. The significant differences associated to control are represented by *** p < 0.001 and ** p < 0.05, both are evaluated by Student’s t-test.
|
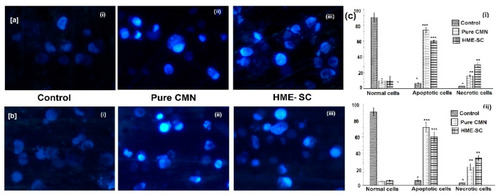
Figure 9. Apoptotic fluorescing image of Hoechst 33258 staining observed under fluorescent microscope with (a,ci) SW480 and (b,cii) Caco-2 cells; (i) control; (ii) pure CMN; and (iii) HME-SC and (c) % of live, apoptotic and necrotic cells after 24 h treatment (i) SW480 and (ii) Caco-2 cells. The significant differences associated to control are represented by *** p < 0.001 and ** p < 0.05, both are evaluated by Student’s t-test.
|
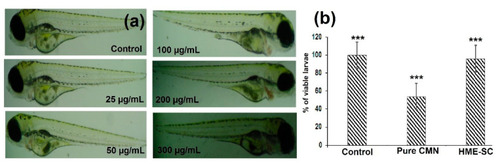
Figure 10. The in vivo toxicity studies of (a) photograph of the zebrafish larvae treated with various concentrations of HME-SC. (b) Graph representing the viable larvae (%) treated with pure CMN and HME-SC for 96 hpf. Significant difference associated to control are specified by *** p < 0.05 and were calculated with Student’s t-test.
PHENOTYPE:
|