
Image
|
Figure Caption
Figure 8
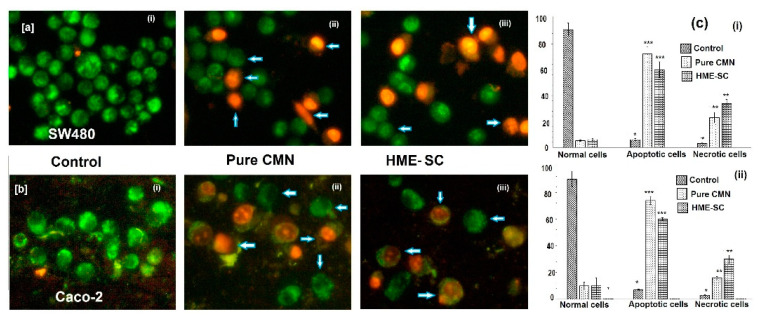
Figure 8. Apoptotic fluorescing image of AO/EB staining observed under fluorescent microscope with (a) SW480 and (b) Caco-2 cells; (i) control; (ii) pure CMN; and (iii) HME-SC and (c) % of live, apoptotic and necrotic cells after 24 h treatment (i) SW480 and (ii) Caco-2 cells. The significant differences associated to control are represented by *** p < 0.001 and ** p < 0.05, both are evaluated by Student’s t-test.
Acknowledgments
This image is the copyrighted work of the attributed author or publisher, and
ZFIN has permission only to display this image to its users.
Additional permissions should be obtained from the applicable author or publisher of the image.
Full text @ Pharmaceuticals (Basel)