
Image
|
Figure Caption
Figure 1
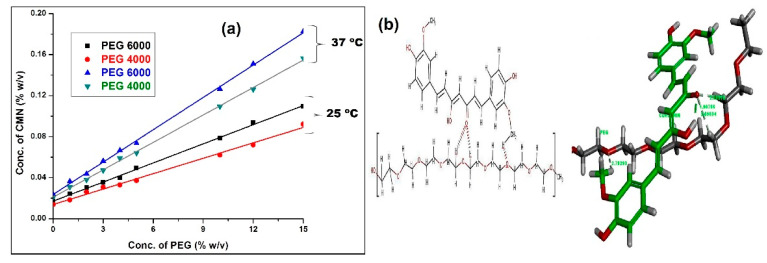
Figure 1. (a) Phase solubility curve of CMN in MilliQ water at 25 and 37 °C in the presence of PEG; (b) molecular modeling for the 1:1 complex of CMN: PEG; two and 3D illustrate the structures of enol form of CMN on the monomer displaying hydrophobic interaction of phenolic OH group. (Green tubes denote the monomer piece of CMN, and Grey tubes denote PEG; dotted lines indicating the most significant bonds, the distances are revealed in Å units).
Acknowledgments
This image is the copyrighted work of the attributed author or publisher, and
ZFIN has permission only to display this image to its users.
Additional permissions should be obtained from the applicable author or publisher of the image.
Full text @ Pharmaceuticals (Basel)