
Image
|
Figure Caption
Figure 10
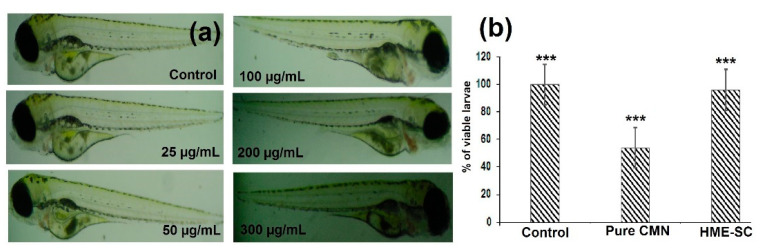
Figure 10. The in vivo toxicity studies of (a) photograph of the zebrafish larvae treated with various concentrations of HME-SC. (b) Graph representing the viable larvae (%) treated with pure CMN and HME-SC for 96 hpf. Significant difference associated to control are specified by *** p < 0.05 and were calculated with Student’s t-test.
Figure Data
Acknowledgments
This image is the copyrighted work of the attributed author or publisher, and
ZFIN has permission only to display this image to its users.
Additional permissions should be obtained from the applicable author or publisher of the image.
Full text @ Pharmaceuticals (Basel)