
FIGURE
Figure 3
- ID
- ZDB-FIG-211002-80
- Publication
- Mohamed et al., 2021 - Preparation of Soluble Complex of Curcumin for the Potential Antagonistic Effects on Human Colorectal Adenocarcinoma Cells
- Other Figures
- All Figure Page
- Back to All Figure Page
Figure 3
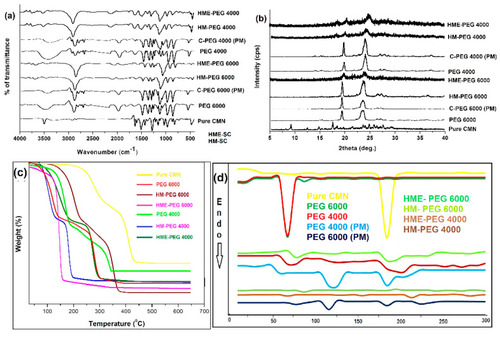
Figure 3. The FTIR spectrum (a), PXRD pattern (b), TGA curve (c), and (d) DSC thermogram of pure CMN, PMs, and SCs. |
Expression Data
Expression Detail
Antibody Labeling
Phenotype Data
Phenotype Detail
Acknowledgments
This image is the copyrighted work of the attributed author or publisher, and
ZFIN has permission only to display this image to its users.
Additional permissions should be obtained from the applicable author or publisher of the image.
Full text @ Pharmaceuticals (Basel)