FIGURE SUMMARY
Title

The Warburg effect is necessary to promote glycosylation in the blastema during zebrafish tail regeneration

Authors
Sinclair, J.W., Hoying, D.R., Bresciani, E., Nogare, D.D., Needle, C.D., Berger, A., Wu, W., Bishop, K., Elkahloun, A.G., Chitnis, A., Liu, P., Burgess, S.M.
Source
Full text @ NPJ Regen Med

Tail regeneration following amputation in zebrafish embryos.

a An illustration showing tissues that are regenerated following tail amputation. b Left, a normal tail fin with the amputation plane indicated with a dashed red line. Right, an image depicting the notochord bead formation (yellow arrowhead) at 3 HPA. Embryos are 3 DPF. Scale bar = 50 µm. c Tail images of PH3+ following tail amputation at indicated timepoints in hours post-amputation. Uninjured embryos are 4 DPF. Amputations were performed at 3 DPF. Images are sum z-stack projections of 1 µM slices through the entire embryo. Scale bar = 100 µm. d Quantification of cell proliferation as determined by PH3+ cells and tail area during regeneration. For tail area, N = 10 at all timepoints. For proliferation, N = 10, 10, 8, 9, and 7 for 3, 24, 48, 72, and 96 HPA, respectively. Mean and SEM are shown. e In situ hybridization of the blastema marker msx3 in uninjured animals and at 24 or 48 HPA. Scale bar = 100 µm. f Stacked percentage graph of msx3 expression as determined by in situ hybridization. A score of 1 represents little to no staining, while a score of 4 represents strong staining. N = 10 embryos for all samples.

Blocking glucose metabolism inhibits tail regeneration.

a Images of 4 DPF embryo tails. Embryos were untreated (control) or treated with 2-DG from 1 DPF throughout the duration of the experiment. Scale bar = 200 µm. b Quantification of tail surface area of untreated or 2-DG treated embryos. Mean and SEM are shown. N = 15 embryos per samples. Statistics were determined using an unpaired t-test. c Images of 7 DPF embryo tails 4 days post amputation. Embryos were untreated (control) or treated with 2-DG from 2 h before the amputation and throughout the duration of the experiment. Scale bar = 200 µm. d Quantification of tail surface area of untreated, 100 mM 2-DG, or 100 mM glucose treated embryos 96 HPA. N = 12 embryos for all samples. Statistics were determined by one-way ANOVA. Mean and SEM are shown. e Quantification of tail surface area of control or 2-DG treated embryos 96 HPA. X-axis indicates timepoint that 2-DG was washed out of media. Mean and SEM are shown. N = 14–15 embryos for all samples. Statistics were determined by one-way ANOVA. f Confocal images of PH3 staining in untreated and 2-DG treated embryo tails at 24 HPA. Images are sum z-stack projections of 1 µM slices through the entire embryo. Scale bar = 100 µm. g Quantification of proliferating cell as determined by PH3 staining. Mean and SEM are shown. N = 10 embryos for all samples. Statistics were determined by an unpaired two-tailed t-test. h Quantification of the tail surface area for untreated or 2-DG treated embryos at 96 HPA. X-axis indicates the timepoint that 2-DG was added to the media. Mean and SEM are shown. N = 20 embryos per sample. Statistics were determined by one-way ANOVA. i In situ hybridization of msx3 in untreated and 2-DG treated embryos at 48 HPA. Scale bar = 100 µm. j Stacked percentage graph of msx3 expression as determined by in situ hybridization. A score of 1 represents little to no staining, while a score of 4 represents strong staining. N = 10 embryos for all samples.

Metabolic reprogramming during early regeneration.

a Heatmap of fluorescent intensity of uninjured and 24 HPA embryos pulsed with 500 µM 2-NBDG for 2 h. Scale bar = 200 µm. b Quantification of 2-NBDG fluorescence in tail of uninjured embryos and notochord bead of 24 HPA embryos. Mean and SEM are shown. N = 18–20 embryos per condition. Statistics were determined with an unpaired two-tailed t-test. c Confocal images of uninjured or 24 HPA Tg(actb2:mito-GFP) embryos. Right panels are zoomed-in images of boxed region in left panels. Scale bar = 50 µm. Images are sum z-stacks of 13 1 µM slices excluding epithelium above and below the notochord and notochord bead on the Z-axis. d Box and whisker plot of mitochondrial volume quantified from the notochord and notochord bead of uninjured and 24 HPA embryos, respectively. Boxes show the 25–75th percentiles, whiskers show the min and max. Lines in the middle of the boxes are the median. N for uninjured sample is 2914 mitochondria from 5 embryos. N for 24 HPA sample is 6791 mitochondria from 5 embryos. Statistics were determined with an unpaired two-tailed t-test. e Histogram of mitochondrial volume quantified from the notochord and notochord bead of uninjured and 24 HPA embryos, respectively. Red arrow indicates increased numbers of small mitochondria after amputation. N for uninjured sample is 2914 mitochondria from 5 embryos. N for 24 HPA sample is 6791 mitochondria from 5 embryos. f Confocal images of uninjured or 24 HPA Tg(actb2:mito-roGFP) embryos. Images are sum z-stacks of 17 1 µM slices excluding epithelium above and below the notochord and notochord bead on the Z-axis. P indicates auto-fluorescent pigment cells which are not depicting roGFP2. A region of oxidized mitochondria can be seen in amputated tails, depicted by the boxed region, which is not seen in a corresponding region of unamputated tails. Scale bar = 50 µm. g Quantification of relative absorbance of roGFP2 at 488 or 405 nm in the notochord bead of 24 HPA embryos or tail of uninjured embryos. N = 12 embryos per condition. Mean and SEM are shown. Statistics were determined with an unpaired two-tailed t-test.

2-DG prevents formation of normal blastema.

a Illustration depicting the region of uninjured and regenerating tail taken for scRNA-seq. b t-SNE plot generated from Louvain clustering of cells from the scRNA-seq data. Number indicates cluster number. c Expression of msx3 and ociad2 transposed onto the t-SNE plot of cells from the scRNA-seq, shown by library. d Violin plots of msx3 and ociad2 expression in control and 2-DG treated blastemas (cluster 2). e t-SNE plot of reclustered blastema. Numbers indicate cluster number. f t-SNE plot of blastema clusters depicted by library. g Violin plots of inhbaa and aldh1a2 expression in the reclustered blastema clusters. h RNA-FISH images of col9a2, inhbaa, and aldh1a2, which depict the notochord / notochord bud, proximal blastema and distal blastema, respectively, in a 48 HPA embryo. Yellow dashed line indicates outline of tail. Scale bar = 100 µm. i Heatmap of marker genes for each reclustered blastema cluster. Cluster 4 and 5 are almost exclusively comprised of untreated control cells while cluster 1 is almost exclusively comprised of 2-DG treated cells. j Heatmap of expression of mesenchymal and blastema genes suppressed by 2-DG treatment.

TGF-β signaling is essential for development of blastema.

a Panther Pathways significantly overrepresented by genes repressed by 2-DG in the blastema (Cluster 2). b Violin plots of tgfb1, inhbaa, inhbb, tgfbr2b, snai1a, and hmga2 expression in control and 2-DG treated blastemas (cluster 2). c Image of the tail of a 96 HPA embryo treated with DMSO or the Alk4, 5, and 7 inhibitor SB431542. Drug was added to embryo media 2 h prior to amputations and treatment persisted through the duration of experiment. Scale bar = 200 µm. d Quantification of tail area of 96 HPA embryos treated with DMSO or SB431542. Drug was added to embryo media 2 h prior to amputations and treatment persisted throughout the duration of experiment. Mean and SEM are shown. N = 13 for each condition. Statistics were determined with an unpaired two-tailed t-test. e In situ hybridization of snai1a and msx3 in DMSO, 2-DG, or SB431542 treated 48 HPA embryos. Scale bar = 100 µm. f Stacked percentage graph of snai1a and msx3 expression as determined by in situ hybridization. A score of 1 represents little to no staining, while a score of 4 represents strong staining. N = 10 embryos for all conditions. g Immunofluorescent staining of P-SMAD2 in uninjured, 24 HPA, and 48 HPA control or 2-D treated embryos. Images are sum z-stack projections of 1 µM slices through the entire embryo. B indicates predicted blastema. Scale bar = 50 µm. h Quantification of P-Smad2 intensity in the blastema. Mean and SEM are shown. N = 10 embryos for all conditions. Statistics were determined with an unpaired two-tailed t-test.

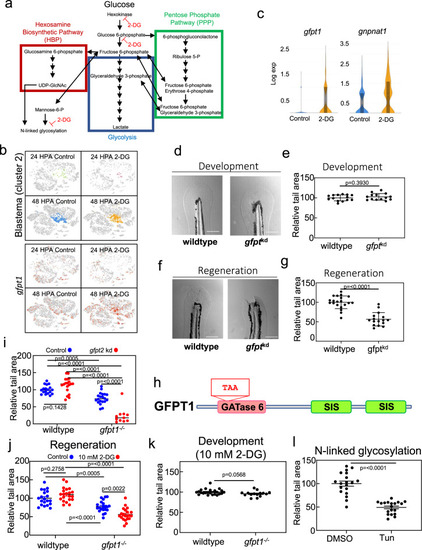
The HBP and N-linked glycosylation trigger tail regeneration.

a Diagram depicting the HBP (red), glycolysis (blue), and the PPP (green). Single-head Arrows indicate pathway intermediates/products. Double-headed arrows indicate shared pathway substrates. Points where 2-DG acts as an inhibitor are indicated. b Expression of gfpt1 transposed onto the t-SNE plot of cells from the scRNA-seq, shown by library. c Violin plots of gfpt1 and gnpnat1 expression in control and 2-DG treated blastemas (cluster 2). d Image of the tail of 4 DPF embryos injected with Cas9 or Cas9 and gRNAs against gfpt1 and gfpt2 (gfptkd), set 1. Scale bar = 200 µm. e Quantification of tail area of 4 DPF embryos injected with Cas9 or Cas9 and gRNAs against gfpt1 and gfpt2 (gfptkd), set 1. Mean and SEM are shown. N = 14 embryos for control and 14 embryos for gfptkd. Statistics were determined an unpaired two-tailed t-test. f Image of 7 DPF embryo tails, 96 HPA, injected with Cas9 or Cas9 and gRNAs against gfpt1 and gfpt2 (gfptkd), set 1. Scale bar = 200 µm. g Quantification of tail area of 7 DPF embryos, 96 HPA, injected with Cas9 or Cas9 and gRNAs against gfpt1 and gfpt2 (gfptkd), set 1. Mean and SEM are shown. N = 20 embryos for control and 16 embryos for gfptkd. Statistics were determined an unpaired two-tailed t-test. h Cartoon depicting glutamine amidotransferase (GATase) 6 and sugar isomerase (SIS) domains of GFPT1. TAA indicates a premature stop codon introduced by a 20 bp deletion in gfpt1. i Quantification of tail area of wild-type or gfpt1−/− 7 DPF embryos, 96 HPA, injected with Cas9 or Cas9 and gRNAs against gfpt2. Mean and SEM are shown. Mean and SEM are shown. N = 18, 19, 20, and 11 embryos for wild-type control, wild-type gfpt2kd, gfpt1/−, and gfpt1−/−; gfpt2kd groups. Statistics were determined with ordinary one-way ANOVA. j Quantification of tail area of 96 HPA wild-type or gfpt1−/− embryos with and without 10 mM 2-DG treatment. Mean and SEM are shown. N = 20–21 embryos for all conditions. Statistics were determined with two-way ANOVA. k Quantification of tail area of 4 DPF wild-type or gfpt1−/− embryos treated with 10 mM 2-DG. Mean and SEM are shown. N = 23 and wild-type embryos and 15 for gfpt1−/− embryos. Statistics were determined with an unpaired two-tailed t-test. l Quantification of tail area of 96 HPA embryos treated with DMSO or Tunicamycin. Drug was added to embryo media 2 h prior to amputations and washed out 24 HPA. Mean and SEM are shown. N = 19 for all conditions. Statistics were determined with an unpaired two-tailed t-test.

Acknowledgments
This image is the copyrighted work of the attributed author or publisher, and ZFIN has permission only to display this image to its users. Additional permissions should be obtained from the applicable author or publisher of the image. Full text @ NPJ Regen Med