|
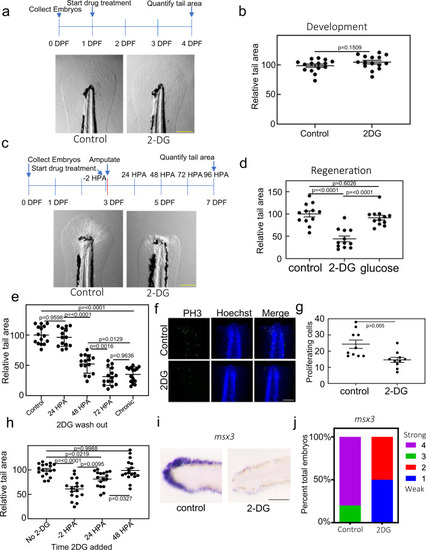
Blocking glucose metabolism inhibits tail regeneration.a Images of 4 DPF embryo tails. Embryos were untreated (control) or treated with 2-DG from 1 DPF throughout the duration of the experiment. Scale bar = 200 µm. b Quantification of tail surface area of untreated or 2-DG treated embryos. Mean and SEM are shown. N = 15 embryos per samples. Statistics were determined using an unpaired t-test. c Images of 7 DPF embryo tails 4 days post amputation. Embryos were untreated (control) or treated with 2-DG from 2 h before the amputation and throughout the duration of the experiment. Scale bar = 200 µm. d Quantification of tail surface area of untreated, 100 mM 2-DG, or 100 mM glucose treated embryos 96 HPA. N = 12 embryos for all samples. Statistics were determined by one-way ANOVA. Mean and SEM are shown. e Quantification of tail surface area of control or 2-DG treated embryos 96 HPA. X-axis indicates timepoint that 2-DG was washed out of media. Mean and SEM are shown. N = 14–15 embryos for all samples. Statistics were determined by one-way ANOVA. f Confocal images of PH3 staining in untreated and 2-DG treated embryo tails at 24 HPA. Images are sum z-stack projections of 1 µM slices through the entire embryo. Scale bar = 100 µm. g Quantification of proliferating cell as determined by PH3 staining. Mean and SEM are shown. N = 10 embryos for all samples. Statistics were determined by an unpaired two-tailed t-test. h Quantification of the tail surface area for untreated or 2-DG treated embryos at 96 HPA. X-axis indicates the timepoint that 2-DG was added to the media. Mean and SEM are shown. N = 20 embryos per sample. Statistics were determined by one-way ANOVA. i In situ hybridization of msx3 in untreated and 2-DG treated embryos at 48 HPA. Scale bar = 100 µm. j Stacked percentage graph of msx3 expression as determined by in situ hybridization. A score of 1 represents little to no staining, while a score of 4 represents strong staining. N = 10 embryos for all samples.
|