|
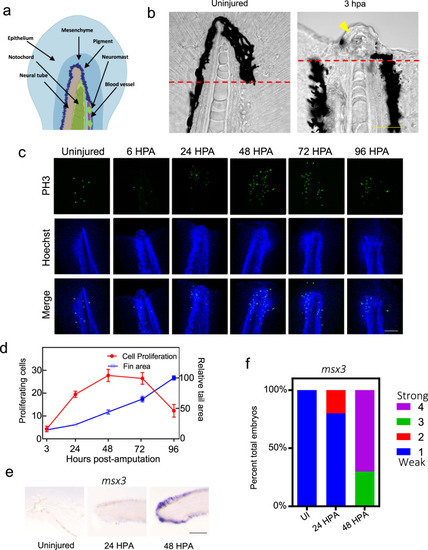
Tail regeneration following amputation in zebrafish embryos.a An illustration showing tissues that are regenerated following tail amputation. b Left, a normal tail fin with the amputation plane indicated with a dashed red line. Right, an image depicting the notochord bead formation (yellow arrowhead) at 3 HPA. Embryos are 3 DPF. Scale bar = 50 µm. c Tail images of PH3+ following tail amputation at indicated timepoints in hours post-amputation. Uninjured embryos are 4 DPF. Amputations were performed at 3 DPF. Images are sum z-stack projections of 1 µM slices through the entire embryo. Scale bar = 100 µm. d Quantification of cell proliferation as determined by PH3+ cells and tail area during regeneration. For tail area, N = 10 at all timepoints. For proliferation, N = 10, 10, 8, 9, and 7 for 3, 24, 48, 72, and 96 HPA, respectively. Mean and SEM are shown. e In situ hybridization of the blastema marker msx3 in uninjured animals and at 24 or 48 HPA. Scale bar = 100 µm. f Stacked percentage graph of msx3 expression as determined by in situ hybridization. A score of 1 represents little to no staining, while a score of 4 represents strong staining. N = 10 embryos for all samples.
|