IMAGE

Fig. 5

ID
ZDB-IMAGE-210927-9
Source
Figures for Sinclair et al., 2021
Image
Figure Caption

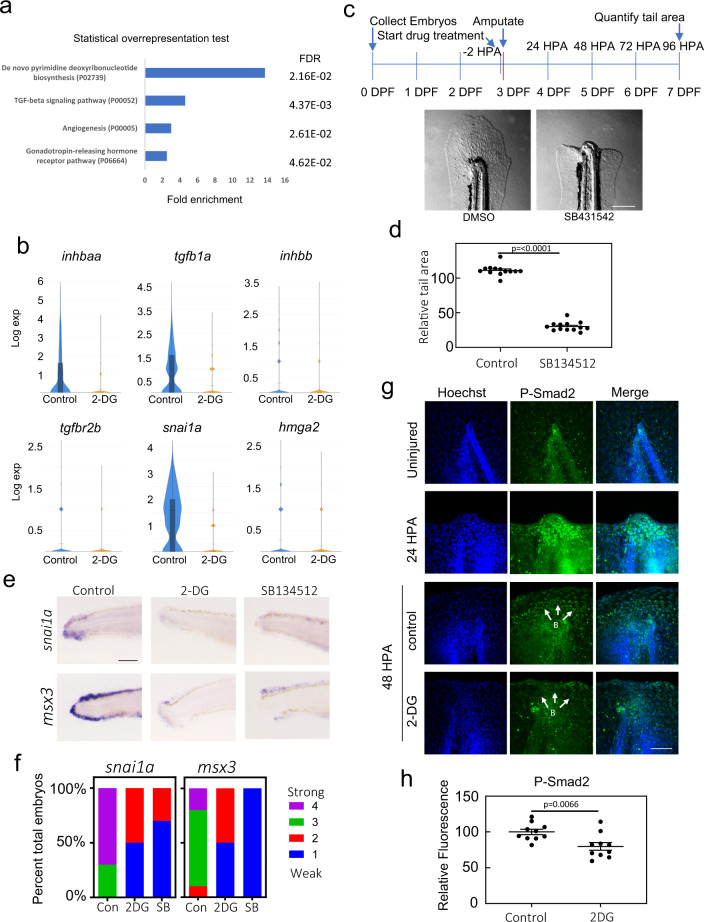
Fig. 5 TGF-β signaling is essential for development of blastema.

a Panther Pathways significantly overrepresented by genes repressed by 2-DG in the blastema (Cluster 2). b Violin plots of tgfb1, inhbaa, inhbb, tgfbr2b, snai1a, and hmga2 expression in control and 2-DG treated blastemas (cluster 2). c Image of the tail of a 96 HPA embryo treated with DMSO or the Alk4, 5, and 7 inhibitor SB431542. Drug was added to embryo media 2 h prior to amputations and treatment persisted through the duration of experiment. Scale bar = 200 µm. d Quantification of tail area of 96 HPA embryos treated with DMSO or SB431542. Drug was added to embryo media 2 h prior to amputations and treatment persisted throughout the duration of experiment. Mean and SEM are shown. N = 13 for each condition. Statistics were determined with an unpaired two-tailed t-test. e In situ hybridization of snai1a and msx3 in DMSO, 2-DG, or SB431542 treated 48 HPA embryos. Scale bar = 100 µm. f Stacked percentage graph of snai1a and msx3 expression as determined by in situ hybridization. A score of 1 represents little to no staining, while a score of 4 represents strong staining. N = 10 embryos for all conditions. g Immunofluorescent staining of P-SMAD2 in uninjured, 24 HPA, and 48 HPA control or 2-D treated embryos. Images are sum z-stack projections of 1 µM slices through the entire embryo. B indicates predicted blastema. Scale bar = 50 µm. h Quantification of P-Smad2 intensity in the blastema. Mean and SEM are shown. N = 10 embryos for all conditions. Statistics were determined with an unpaired two-tailed t-test.

Acknowledgments
This image is the copyrighted work of the attributed author or publisher, and ZFIN has permission only to display this image to its users. Additional permissions should be obtained from the applicable author or publisher of the image. Full text @ NPJ Regen Med