FIGURE SUMMARY
Title

The E3 ubiquitin ligase component, Cereblon, is an evolutionarily conserved regulator of Wnt signaling

Authors
Shen, C., Nayak, A., Neitzel, L.R., Adams, A.A., Silver-Isenstadt, M., Sawyer, L.M., Benchabane, H., Wang, H., Bunnag, N., Li, B., Wynn, D.T., Yang, F., Garcia-Contreras, M., Williams, C.H., Dakshanamurthy, S., Hong, C.C., Ayad, N.G., Capobianco, A.J., Ahmed, Y., Lee, E., Robbins, D.J.
Source
Full text @ Nat. Commun.

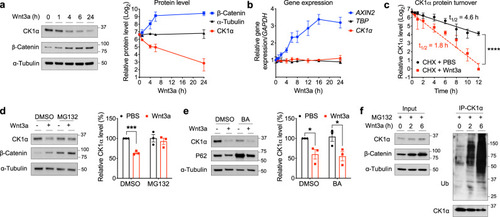
Wnt signaling regulates CK1α levels via ubiquitin-dependent proteasomal degradation.

a Extracts of HEK cells treated with Wnt3a for various lengths of time were evaluated by immunoblotting. A representative immunoblot (left panel) or quantitation of immunoblots (mean ± SEM, n = 4 independent experiments; right panel) is shown. b RNA from HEK cells treated with Wnt3a for various lengths of time was used to determine the expression of the indicated genes, using quantitative RT-PCR analysis. Quantification of gene expression (mean ± SEM, n = 3 independent experiments) is shown. c HEK cells were co-treated with cycloheximide and PBS or Wnt3a for the indicated time and extracts of these cells were evaluated by immunoblotting for CK1α or HSP90. CK1α levels from immunoblots were quantitated, normalized to that of HSP90, and plotted to determine CK1α turnover in response to Wnt3a (mean ± SEM, n = 3 independent experiments). Asterisks indicate statistical significance (two-way ANOVA analysis, ****p value < 0.0001). d Extracts of HEK cells treated for 6 h with PBS or Wnt3a, together with DMSO or 10 μM MG132, were evaluated by immunoblotting. A representative immunoblot (left panel) and a quantification of immunoblots from (mean ± SEM, n = 3 independent experiments; right panel) are shown. e Extracts of HEK cells treated for 24 h with PBS or Wnt3a, together with DMSO or 20 nM bafilomycin A1 (BA), were evaluated by immunoblotting. A representative immunoblot (left panel) and a quantification of immunoblots (mean ± SEM, n = 3 independent experiments; right panel) are shown. P62 is a biomarker for lysosomal/autophagosomal inhibition. Asterisks in d and e indicate statistical significance (two-tailed Student’s t-test, *p value < 0.05, ***p value < 0.001). f CK1α was immunoprecipitated from the lysates of HEK cells treated with Wnt3a and MG132 for various time points, followed by analyses of the indicated proteins by immunoblotting. A representative immunoblot (n = 3 independent experiments) is shown.

Wnt-induced degradation of CK1α requires CRBN, the substrate receptor of the CRL4<sup>CRBN</sup> E3 ubiquitin ligase complex.

a HEK cells were transfected with the indicated smart-pool siRNA and subsequently treated with PBS or Wnt3a for 24 h. Extracts of these cells were evaluated by immunoblotting. A representative immunoblot (n = 5 independent experiments) is shown. b HEK cells were transfected with the indicated smart-pool siRNA and co-treated with Wnt3a and cycloheximide for the indicated time. Extracts of these cells were evaluated by immunoblotting. CK1α levels from immunoblots were quantitated and normalized to HSP90 levels (mean ± SEM, n = 3 independent experiments). Asterisks indicate statistical significance (two-way ANOVA analysis, ****p value < 0.0001). c A schematic outlining experimental details of the in vitro binding and ubiquitination assays shown respectively in panels d and e. d HEK cells were transfected with a plasmid encoding Flag-CRBN and subsequently treated with PBS or Wnt3a for 4 h. Flag-CRBN immunoprecipitated from extracts of these cells were incubated with the indicated amounts of recombinant GST-CK1α at 4 °C for 1 h. Flag-CRBN beads were re-isolated, washed, and CK1α bound was eluted using sample buffer. These immunoprecipitates were subjected to SDS-PAGE, followed by silver staining (top panel) or immunoblotting (bottom panel). IgG beads serve as a control for Flag-CRBN beads (left lane) and recombinant GST-CK1α a loading control (right lane). A representative gel image and immunoblot (n = 3 independent experiments) is shown. e HEK cells were transfected with a plasmid encoding Flag-CRBN and subsequently treated with PBS or Wnt3a for 4 h. Flag-CRBN immunoprecipitated from extracts of these cells were incubated with a mixture of recombinant GST-CK1α, ubiquitin, and a mixture of E1 and E2 ligases in the presence of vehicle or Mg-ATP, and incubated at 30 °C for 3 h. These reaction mixtures were subsequently analyzed by immunoblotting for the indicated proteins. A representative immunoblot (n = 3 independent experiments) is shown.

The β-Catenin destruction complex regulates CRBN-mediated CK1α degradation.

a Extracts of HEK cells treated with Wnt3a for various lengths of time were evaluated by immunoblotting. Quantitation of immunoblots (mean ± SEM, n = 3 independent experiments) is shown. Levels of phosphorylated β-Catenin were normalized to that of total β-Catenin. b HEK cells were transfected with control (CTRL) siRNA or one of three distinct CRBN siRNA, followed by PBS or Wnt3a treatment for 24 h. Extracts of these cells were evaluated by immunoblotting. c CRBN was immunoprecipitated from extracts of HEK cells treated with PBS or Wnt3a in the presence of MG132 for 4 h, followed by immunoblotting of the indicated proteins. d HEK cells were co-transfected with control (CTRL) siRNA or smart-pool AXIN1 or APC siRNA, along with one of two distinct CRBN siRNA. Extracts of these cells were evaluated by immunoblotting. A representative immunoblot (n = 3 independent experiments) is shown in bd.

Wnt signaling induced CRBN-mediated degradation of CK1α requires its IMiD binding pocket.

a A structural model of CRBN-lenalidomide-CK1α complex (PDB: 5fqd). The interacting residues at the interface of the CRBN (green with white text) and CK1α (magenta with white text) are shown as a ball and stick model. The IMiD binding pocket is depicted in blue. b HEK cells were transfected with a plasmid encoding wild-type (WT) HA-tagged CK1α or an HA-tagged CK1α mutant, followed by PBS or Wnt3a treatment for 24 h. Extracts of these cells were evaluated by immunoblotting. A representative immunoblot (left panel) and a quantification of immunoblots (mean ± SEM, n = 3 independent experiments; right panel) are shown. c HEK cells were transfected with a plasmid encoding WT Flag-tagged CRBN or the indicated Flag-tagged CRBN mutants. Extracts of these cells were evaluated by immunoblotting. A representative immunoblot (left panel) and a quantification of immunoblots (mean ± SEM, n = 3 independent experiments; right panel) are shown. d HEK cells were transfected with a plasmid encoding WT Flag-tagged CRBN the indicated Flag-tagged CRBN mutants and subsequently treated with PBS or Wnt3a for 4 h. Flag-CRBN immunoprecipitated from extracts of these cells were incubated with the indicated amounts of recombinant GST-CK1α at 4 °C for 1 h. Flag-CRBN beads were re-isolated, washed, and CK1α bound was eluted using sample buffer. These immunoprecipitates were subjected to SDS-PAGE, followed by immunoblotting. IgG beads serve as a control for Flag-CRBN beads. A representative immunoblot (left panel) and a quantification of immunoblots (mean ± SEM, n = 3 independent experiments; right panel) are shown. Asterisks in bd indicate statistical significance (two-tailed Student’s t-test, *p value < 0.05, ****p value < 0.0001).

Wnt signaling induces CRBN-mediated degradation of a subset of endogenous substrates.

a HEK cells were transfected with the indicated smart-pool siRNA, followed by PBS or Wnt3a treatment for 24 h. Extracts of these cells were evaluated by immunoblotting. A representative immunoblot (n = 3 independent experiments) is shown. bd HEK cells were co-treated with cycloheximide along with PBS or Wnt3a. Extracts of these cells were evaluated by immunoblotting. CK1α levels from immunoblots were quantitated, normalized to HSP90 levels, and plotted to determine the turnover of the indicated protein in response to Wnt3a (mean ± SEM, n = 3 independent experiments). eg HEK cells were transfected with control (CTRL) or one of two distinct CRBN siRNA and co-treated with Wnt3a and cycloheximide. Extracts of these cells were evaluated by immunoblotting. CK1α levels from immunoblots were quantitated, normalized to HSP90 levels, and plotted to determine the turnover of the indicated protein in response to Wnt3a (mean ± SEM, n = 3 independent experiments). Asterisks in bg indicate statistical significance (two-way ANOVA analysis, ***p value < 0.001, ****p value < 0.0001). h Extracts of HEK cells treated for 24 h with different doses of Wnt3a or lenalidomide were evaluated by immunoblotting. A representative immunoblot (n = 3 independent experiments) is shown.

CRBN is a positive regulator of Wnt activity.

a The Wnt reporter gene expressing cell line, HEK293STF, was transfected with control (CTRL) siRNA or one of two distinct CRBN siRNA and treated with PBS or Wnt3a (100 ng/mL) for 48 h. Luciferase activity was subsequently determined and normalized to total protein concentration. A quantification of Wnt reporter activity (mean ± SEM, n = 3 independent experiments) is shown. b HEK293STF cells were transfected with a control plasmid or a plasmid encoding wild-type (WT) Flag-tagged CRBN, or the indicated Flag-tagged CRBN mutants for 48 h. Luciferase activity was determined and normalized to total protein concentration. A quantification of Wnt reporter activity (mean ± SEM, n = 3 independent experiments) is shown. c A schematic of a mouse intestinal organoid showing the presumptive crypt (C) and villus (V) regions. d Mouse intestinal organoids were infected with control (Ctrl) or one of two distinct Crbn shRNA (marked by GFP expression) and then cultured in (i) basal media or (ii–iv) 25% exogenous Wnt conditioned media (L-WRN) for 5 days. Representative images are shown (n = 3 independent experiments). Scale bar = 100 μm. e. Quantification of the percent of organoids that exhibit a more basal-like phenotype (mean ± SD, n = 3 technical replicates) in a representative experiment (n = 3 independent experiments) is shown. Asterisks in a, b, and e indicate statistical significance (two-tailed Student’s t-test, **p value < 0.01, ****p value < 0.0001).

CRBN modulates Wnt function in Drosophila.

a A schematic showing a Drosophila melanogaster wing imaginal disc. A anterior; P posterior; D dorsal; V ventral. b Representative confocal images showing the level of the Wg/Wnt biomarker Senseless (Sens, magenta) after RNAi-mediated knockdown of (i–iii) yellow (y) control or (iv–vi) ohgata (ohgt/crbn), driven by a hh-Gal4 driver in the posterior compartment of third instar wing imaginal disks. The region in which hh-Gal4 drives expression is indicated by Engrailed (En) in green. DAPI staining (blue) is used to mark the wing disc. hh hedgehog, dcr dicer. Scale bar = 50 μm. c A quantification of wing disks with a defect in Sens levels is shown. Asterisks indicate statistical significance (Fisher’s exact test, ****p value < 0.0001).

CRBN modulates Wnt function in zebrafish.

a A schematic of transverse views of a zebrafish head indicating phenotypes regulated by Wnt signaling. White arrows indicate eyes and the balbis indicates the distance between eyes. b The transverse views of a (i) WT zebrafish head, a WT zebrafish head injected with (ii) crbn mRNA, or (iii–v) one of three distinct crbn guide RNAs (sgRNA) along with dCas9 mRNA, in the absence or presence of (iv) crbn mRNA or (v) β-catenin (ctnnb1) mRNA. White arrows indicate eyes, the gray arrow indicates merged eyes, and the balbis indicates the distance between eyes. Scale bar = 200 μm. c, e and g Quantifications of the indicated eye phenotypes are shown. Asterisks indicate statistical significance (Fisher’s exact test, *p value < 0.05, ****p value < 0.0001). d and f RNA extracts from the indicated zebrafish (20 hpf) were used to determine the expression of three Wnt target genes using quantitative RT-PCR. Quantification of gene expression in indicated zebrafish embryos (mean ± SEM, n = 3 independent pools of zebrafish embryo) is shown. Asterisks indicate statistical significance (two-tailed Student’s t-test, *p value < 0.05, ***p value < 0.001, ****p value < 0.0001). lef1 lymphoid enhancer-binding factor 1.

A model depicting Wnt-driven, CRBN-dependent regulation of CK1α.

Upon stimulation of Wnt signaling, CRBN is recruited to the β-Catenin destruction complex and targets CK1α for degradation, further promoting Wnt pathway activation.

ZFIN is incorporating published figure images and captions as part of an ongoing project. Figures from some publications have not yet been curated, or are not available for display because of copyright restrictions.

ZFIN is incorporating published figure images and captions as part of an ongoing project. Figures from some publications have not yet been curated, or are not available for display because of copyright restrictions.

Acknowledgments
This image is the copyrighted work of the attributed author or publisher, and ZFIN has permission only to display this image to its users. Additional permissions should be obtained from the applicable author or publisher of the image. Full text @ Nat. Commun.