
- Title
-
Nuclear Organization during Hepatogenesis in Zebrafish Requires Uhrf1
- Authors
- Madakashira, B.P., Zhang, C., Macchi, F., Magnani, E., Sadler, K.C.
- Source
- Full text @ Genes (Basel)

Hepatocyte nuclei increase in size, become elliptical and reduce nucleoli number during hepatic outgrowth. (A). Representative confocal images of Hoechst-stained hepatocytes from larvae at 80, 96, and 120 hpf. Regions depleted of Hoechst staining represent euchromatic regions, strong Hoechst foci represent heterochromatin. Yellow N indicates nucleolus; White arrows point to examples of the prominent nuclear lamina. Scale bar: 5 μm (B). 3D reconstructions of Z-stacks of Hoechst-stained hepatocyte nuclei at 80, 96, and 120 hpf display changes in size and shape as the embryo ages. Morphological measurements obtained from hepatocyte nuclei were analyzed using Las-X software for volume (C), surface area (D), sphericity (E), and ellipsoid mean (F). Each dot on the graph represents an individual nucleus, and the horizontal represents the median Hepatocyte nuclei were scored for the number of nucleoli per hepatocyte (G) and the presence of normal nuclear lamina observed as a rim around the nucleus by Hoechst staining (H). All measurements except sphericity were obtained by automated measurements in LasX software, while the sphericity was calculated based on surface area and volume measurements. All analyses were performed on larvae from 3 clutches, with minimum of 3 livers analyzed per clutch. ** p < 0.005, **** p < 0.00005. L–nuclear lamina, N-nucleoli. Magnification: 63×, 4× zoom, Scale bar: 5 μm. |
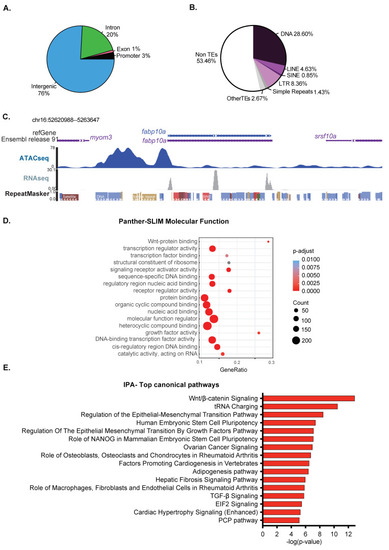
The chromatin landscape in 120 hpf zebrafish livers remains competent for development. (A). ATAC-Seq peaks in the 120 hpf zebrafish liver were categorized based on the proportion in distinct genomic elements designated as a promoter (1 kb +/− TSS), exon, intron, and intergenic. In total, 575 promoters are covered by ATAC-Seq peaks. (B). The relative proportion of transposable elements (TEs) across open chromatin region in zebrafish liver at 120 hpf. TE families, including DNA, LINE, SINE, LTR, and simple repeats, are represented with different colors. The other types of REs and non-RE regions are represented as others. (C). Browser view of ATAC-Seq and RNA-Seq from 120 hpf livers from the fabp10a gene locus and surrounding regions. Note the DNA transposon located in the center of the ATAC-Seq peak is not expressed in this sample. (D). Gene Ontology analysis of the molecular function of genes that either overlap with ATAC-Seq peaks or are the nearest to a peak falling in intergenic regions. The canonical process with annotated genes from open chromatin regions. The top 20 categories from each section were plotted. Dot size in (D) represents the number of overlap input genes with the specific geneset. (E). IPA analysis of the pathways that are enriched in the same ATAC-Seq positive genes used in (D). |
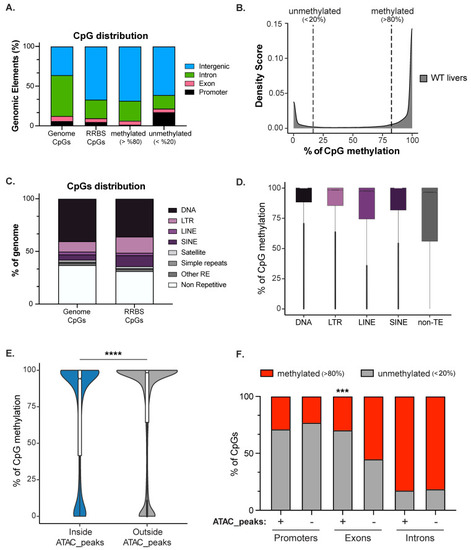
DNA methylation is enriched in the intergenome and on transposons. (A). RRBS Genomic Annotation on 120 hpf zebrafish livers of the CpGs common to the unified dataset of 3 biological replicates from 120 WT zebrafish larvae (2,173,502 CpGs). CpGs were categorized as methylated (>80%; 1,521,222 CpGs) and unmethylated (<20%; 427,492 of CpGs) and then were classified based on annotated genomic elements. The distribution of CpGs in the whole genome is plotted as a comparison. (B). Density plot showing the distribution of CpGs based on methylation level. (C). Annotation of CpGs contained in the Repetitive Elements (REs) or not-RE in zebrafish genome and RRBS dataset. (D). Box plot displaying the percent of methylation of CpGs contained in each Class of Transposable Elements (TEs) and not-TEs. (E). Violin plot displays the percent of CpG methylation in zebrafish livers contained inside (blue) or outside (grey) ATAC-Seq peaks. An equal number of CpGs (11,034 CpGs) contained outside of ATAC-seq peaks were randomly selected for comparison. **** indicates p-value < 0.0001 calculated by unpaired non-parametric Mann–Whitney test. (F). Box plot displaying the percent of CpGs either methylated (red, >80%) or not-methylated (grey, <20%) in WT livers: From left, CpGs contained inside (represented with +) or outside (represented with −) of ATAC-Seq peaks classified based on their location in annotated genomic element (promoters, exons, and introns). p-values were calculated by unpaired non-parametric multiple comparisons Kruskal-Wallis test. *** means p-value < 0.001. |

Expression of genes involved in signaling pathways enriched during early hepatic outgrowth. (A). RNA-Seq comparative analysis on differential expression of 120 hpf zebrafish livers compared to 78 hpf livers classified as expressed based on log2FC > 1.5 and padj < 0.05 represented by Venn diagram showing that most genes are already expressed at 78 hpf. (B). MA plot showing log2 fold change of genes at 120 hpf calculated on 78 hpf WT livers and Base Mean. In green upregulated genes (padj < 0.05 and log2FC > 1.5), in blue downregulate genes (padj < 0.05 and log2 Fold Change <−1.5) and in grey all other genes. (C). Gene Ontology of Biological Processes for genes categorized in B, with the 10 most significant terms for each group plotted. Numbers in each circle represent the number of genes of each GO term that are captured in the dataset plotted. (D). IPA of top 10 canonical pathways enriched for each group. (E). Violin plot displaying expression values of genes contained in open regions (inside ATAC) and in closed regions (outside ATAC) indicates that genes present in open regions are more expressed than genes not covered by ATAC-seq. **** indicates p-value < 0.0001 measured by unpaired t-test. |

PHENOTYPE:
|

|