
Figure 2
- ID
- ZDB-FIG-210810-57
- Publication
- Madakashira et al., 2021 - Nuclear Organization during Hepatogenesis in Zebrafish Requires Uhrf1
- Other Figures
- All Figure Page
- Back to All Figure Page
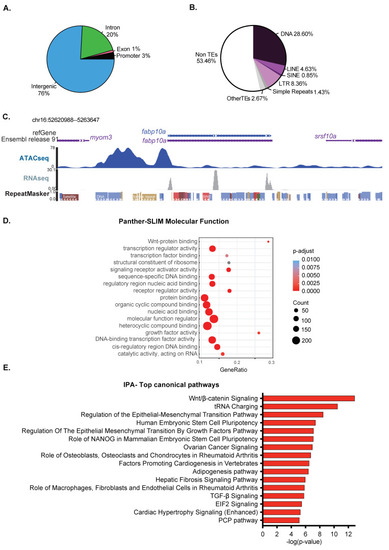
The chromatin landscape in 120 hpf zebrafish livers remains competent for development. (A). ATAC-Seq peaks in the 120 hpf zebrafish liver were categorized based on the proportion in distinct genomic elements designated as a promoter (1 kb +/− TSS), exon, intron, and intergenic. In total, 575 promoters are covered by ATAC-Seq peaks. (B). The relative proportion of transposable elements (TEs) across open chromatin region in zebrafish liver at 120 hpf. TE families, including DNA, LINE, SINE, LTR, and simple repeats, are represented with different colors. The other types of REs and non-RE regions are represented as others. (C). Browser view of ATAC-Seq and RNA-Seq from 120 hpf livers from the fabp10a gene locus and surrounding regions. Note the DNA transposon located in the center of the ATAC-Seq peak is not expressed in this sample. (D). Gene Ontology analysis of the molecular function of genes that either overlap with ATAC-Seq peaks or are the nearest to a peak falling in intergenic regions. The canonical process with annotated genes from open chromatin regions. The top 20 categories from each section were plotted. Dot size in (D) represents the number of overlap input genes with the specific geneset. (E). IPA analysis of the pathways that are enriched in the same ATAC-Seq positive genes used in (D). |