
Figure 3
- ID
- ZDB-FIG-210810-58
- Publication
- Madakashira et al., 2021 - Nuclear Organization during Hepatogenesis in Zebrafish Requires Uhrf1
- Other Figures
- All Figure Page
- Back to All Figure Page
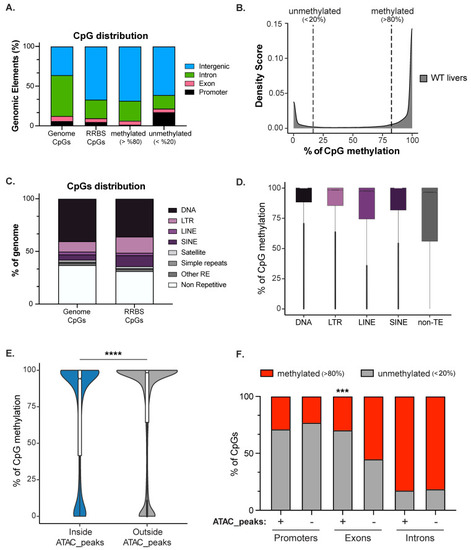
DNA methylation is enriched in the intergenome and on transposons. (A). RRBS Genomic Annotation on 120 hpf zebrafish livers of the CpGs common to the unified dataset of 3 biological replicates from 120 WT zebrafish larvae (2,173,502 CpGs). CpGs were categorized as methylated (>80%; 1,521,222 CpGs) and unmethylated (<20%; 427,492 of CpGs) and then were classified based on annotated genomic elements. The distribution of CpGs in the whole genome is plotted as a comparison. (B). Density plot showing the distribution of CpGs based on methylation level. (C). Annotation of CpGs contained in the Repetitive Elements (REs) or not-RE in zebrafish genome and RRBS dataset. (D). Box plot displaying the percent of methylation of CpGs contained in each Class of Transposable Elements (TEs) and not-TEs. (E). Violin plot displays the percent of CpG methylation in zebrafish livers contained inside (blue) or outside (grey) ATAC-Seq peaks. An equal number of CpGs (11,034 CpGs) contained outside of ATAC-seq peaks were randomly selected for comparison. **** indicates p-value < 0.0001 calculated by unpaired non-parametric Mann–Whitney test. (F). Box plot displaying the percent of CpGs either methylated (red, >80%) or not-methylated (grey, <20%) in WT livers: From left, CpGs contained inside (represented with +) or outside (represented with −) of ATAC-Seq peaks classified based on their location in annotated genomic element (promoters, exons, and introns). p-values were calculated by unpaired non-parametric multiple comparisons Kruskal-Wallis test. *** means p-value < 0.001. |