- Title
-
A natural acylphloroglucinol triggered antiproliferative possessions in HEL cells by impeding STAT3 signaling and attenuating angiogenesis in transgenic zebrafish model
- Authors
- Hu, M., Varier, K.M., Li, Z., Qin, X., Rao, Q., Song, J., Hu, A., Hang, Y., Yuan, C., Gajendran, B., Shu, L., Wen, M., Li, Y., Liu, H.
- Source
- Full text @ Biomed. Pharmacother.
|
Fig. 1. L72 treatment triggered an anticancer effect in human cancer cell lines. (A) Callistemon salignus. (B) Structure of L72. (C) IC50 values after treatment with L72 in indicated cell lines for 48 h. (D) Cell morphology of HEL cells after treatment with L72 with indicated doses for 48 h (40X magnification). |
|
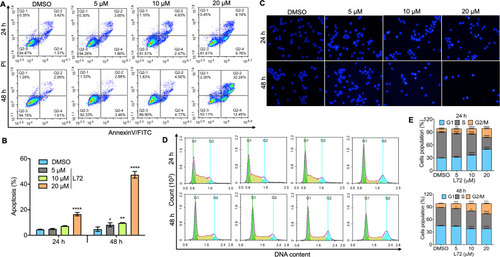
Fig. 2. L72 caused dose and time-dependent apoptosis in the G2/M cell cycle phase in HEL cells. (A) Flow cytometric analysis after propidium iodide staining at 24 and 48 h of incubation, at the indicated doses of L72 treatment. (B) Densitometry of the cells undergoing apoptosis at various stages of the cell cycle at an indicated time interval of L72 incubation. Data were represented as mean ± SD (n = 3). (C) HEL cells were treated by L72 at indicated doses and stained with Hochest 33258, depicting the presence of damaged nuclei through a fluorescence microscope (100X). (D) The cell cycle of HEL cells was analyzed in flow cytometry after propidium iodide staining at 24 and 48 h of incubation. (E) Densitometry of the cells undergoing apoptosis at various stages of the cell cycle at an indicated time interval of incubation. *p < 0.05, **p < 0.01, ***p < 0.001, ****p < 0.0001, versus control. |
|
Fig. 3. Variations of MMP in HEL cells after L72 treatment. (A) HEL cells treated with L72 for 24 h were stained with Jc-1 and analyzed by flow cytometry. (B) Graph showing the percentage of depolarized cells in mitochondria at various concentrations of L72 treatment. ****p < 0.0001 versus control. (C) The L72 treated cells were observed under a fluorescence microscope to differentiate the Jc-1 monomers and polymers. (D) The protein expression of indicated proteins after L72 treatment at the indicated doses for 24 h. GAPDH is used as a loading control. The relative densities (RD) normalized with GAPDH. |
|
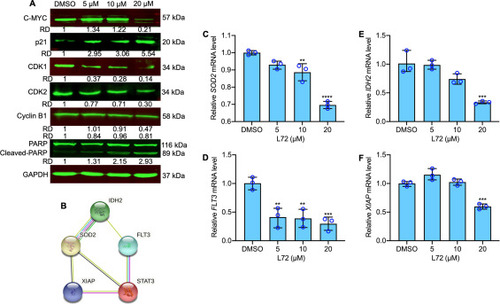
Fig. 4. Effect of L72 on apoptosis favoring pathway molecules. (A) The protein expression of indicated proteins after L72 treatment at the indicated doses for 24 h. GAPDH is used as a loading control. The relative densities (RD) normalized with GAPDH. (B) String database results indicating the protein-protein interactions. (C–F) Relative gene expression analysis of SOD2 (C), FLT3 (D), IDH2 (E), XIAP (F). Values were normalized with GAPDH. **p < 0.01, ***p < 0.001, ****p < 0.0001, versus control. |
|
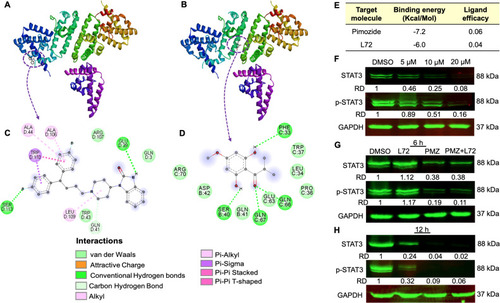
Fig. 5. L72 treatment inhibited STAT3 in HEL cells. (A) 3D interactive autodock image showing the interaction of pimozide with STAT3. (B) 3D interactive autodock image showing the interaction of L72 with STAT3. (C) 2D image showing amino acids interrelating between pimozide with STAT3. (D) 2D image showing amino acids interacting between L72 with STAT3. (E) Interaction parameters of pimozide and L72 with STAT3. (F) The protein expression of STAT3 after L72 treatment at the indicated doses for 24 h. GAPDH is used as a loading control. (G) The protein expression of STAT3 after DMSO, L72 (20 µM), pimozide (10 µM), L72 (20 µM) + Pimozide (10 µM) treatment at 6 (G) and 12 h (H) of incubation. GAPDH is used as a loading control. The relative densities (RD) normalized with GAPDH. |
|
Fig. 6. L72 triggers apoptosis by attenuating angiogenesis in zebrafishes. (A) Intersegmental angiogenesis of transgenic zebrafish 72 hpf embryos exposed to different concentrations of L72. (B) Embryo and larva mortality rate of transgenic zebrafish exposed to different concentrations of L72. (C) Larval malformation rate of transgenic zebrafish exposed to different concentrations of L72. (D) Embryo heart rate of transgenic zebrafish exposed to different concentrations of L72. (E,F) Embryo hatching rate of transgenic zebrafish exposed to different concentrations of L72 at 48 hpf (E) and 72 hpf (F). (G–I) Relative expression of genes, Flk-1 (G), EGFP (H) and STAT3 (I) treated with 4.8 µM of L72 on 24 hpf transgenic zebrafish. **p < 0.01, ***p < 0.001, ****p < 0.0001, versus blank. |
|
Fig. 7. Molecular action of L72, both invitro, and invivo. The L72 after entering the plasma membrane causes inhibition of FLT3, IDH2, STAT3, and Flk-1. Meanwhile, it generates reactive oxygen species (ROS) and mitochondrial membrane damage-causing alterations in MMP. This results in the release of cytochrome c and activation of p21. This activation eventually triggers apoptotic gene transcription in the nucleus, causing cellular apoptosis. The fore-mentioned inhibition of STAT3 causes the lack of transcription of cell survival genes. Moreover, inhibition of Flk-1 promotes anti-angiogenesis, inhibiting the formation of new cells or vasculatures. All these events favored cellular apoptosis, after L72 administration. |


