
Image
|
Figure Caption
Fig. 4
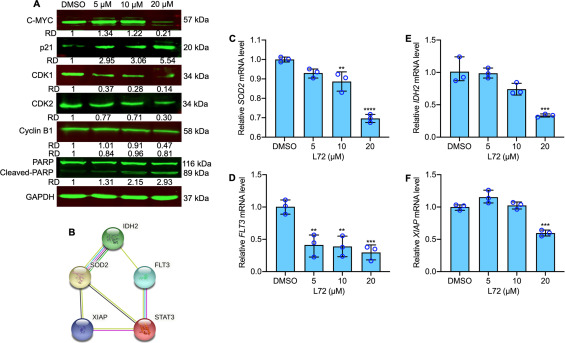
Fig. 4. Effect of L72 on apoptosis favoring pathway molecules. (A) The protein expression of indicated proteins after L72 treatment at the indicated doses for 24 h. GAPDH is used as a loading control. The relative densities (RD) normalized with GAPDH. (B) String database results indicating the protein-protein interactions. (C–F) Relative gene expression analysis of SOD2 (C), FLT3 (D), IDH2 (E), XIAP (F). Values were normalized with GAPDH. **p < 0.01, ***p < 0.001, ****p < 0.0001, versus control.
Acknowledgments
This image is the copyrighted work of the attributed author or publisher, and
ZFIN has permission only to display this image to its users.
Additional permissions should be obtained from the applicable author or publisher of the image.
Full text @ Biomed. Pharmacother.