FIGURE SUMMARY
Title

Transient, flexible gene editing in zebrafish neutrophils and macrophages for determination of cell-autonomous functions

Authors
Isiaku, A.I., Zhang, Z., Pazhakh, V., Manley, H.R., Thompson, E.R., Fox, L.C., Yerneni, S., Blombery, P., Lieschke, G.J.
Source
Full text @ Dis. Model. Mech.

Transgenes for leukocyte lineage-specific gene editing in zebrafish. (A) For gene editing in neutrophils, a tol2-flanked UAS:Cas9 construct was microinjected into one-cell-stage Tg(mpx:KalTA4) embryos. Nuclear localization signal (NLS) motifs target Cas9 to the nucleus. This construct carried a Tg(clmc2-RFP) tracer marker. (B) For gene editing in macrophages, a different tol2-flanked UAS:Cas9 construct was microinjected into one-cell-stage Tg(mpeg1:Gal4FF) embryos that carried a Tg(cryaa-EGFP) tracer marker. Each background carried a Tg(UAS:NTR-mCherry) transgene. (C,D) Embryos with red leukocytes from the Tg(UAS:NTR-mCherry) reporter driven by either mpx:KalTA4 (neutrophil) or mpeg1:Gal4FF (macrophage) transgenes, co-segregating with the two different UAS:Cas9 transgenes indicated by their respective tracer marker [white arrowheads, red heart (C) and green eye (D)], shown for F2 Tg(mpx-Cas9) (C) and F3 Tg(mpeg1-Cas9) (D) embryos. The Tg(mpeg1-Cas9) line also carried Tg(mpx:EGFP), marking neutrophils green (D). Scale bars: 200 µm. (E-G) Quantitative PCR showing relative Cas9 mRNA expression for Tg(mpx-Cas9) (E), Tg (mpeg-Cas9) (F) and a comparison of both (G). Data normalized to housekeeping gene (ppial) and represent mean replicates of three runs at different time points differentiated by shapes: black circles, 3 dpf; black squares, 4 dpf; black triangles, 5 dpf. No differences exist between timepoints within genotypes. Unpaired two-tailed Student’s t-test. P-values are shown. (H-J) mCherry reporter gene knockdown in Tg(mpx-Cas9) and Tg(mpeg1-Cas9) embryos following delivery of a multiplexed mCherry gRNA pair targeting the transcript from the UAS:NTR-mCherry reporter (gRNA validation presented in Fig. S3). Embryos for gRNA injection were generated from Tg(mpx-Cas9) and Tg(mpeg1-Cas9) incrosses. As the incrossed fish were not confirmed as homozygous for all transgenes, there was the possibility of segregation of the Gal4 driver, UAS:Cas9 effector and UAS:NTR-mCherry reporter transgenes; hence, a categorical scoring system (absent/dim/medium/bright) was used to detect a shift towards reduced mCherry expression (further details in Fig. S3). Prior to scoring, embryos were selected for the independent backbone markers confirming the presence of the UAS:Cas9 effector [red heart for Tg(mpx-Cas9) (C, white arrowhead); green eye for Tg(mpeg1-Cas9) (D, white arrowhead)]; this line also carries the Tg(mpx:EGFP) marker resulting in green neutrophils. (H) Knockdown of mCherry expression in Tg(mpx-Cas9) neutrophils [percentage absent+dim, 15.6% (WT) versus 23.8% (gRNA injected)]. (I,J) A similar shift towards duller categories occurred in Tg(mpeg1-Cas9) mCherry macrophages (J), without any alteration in the distribution of EGFP-expressing neutrophils, serving as an internal negative control (I). Pooled data from two (H) and three (I,J) independent experiments, total pooled n values are shown within columns. P-values from chi-square test. n.s., not significant.

On-target lamin B receptor (lbr) gene editing in neutrophils of Tg(mpx-cas9) zebrafish embryos. (A) Schematic of experimental steps for in vivo gene editing in neutrophils. (B) Zebrafish lbr locus showing gRNA target site in exon 2. (C) High-level on-target lbr gene editing from synthetic gRNA delivery. (Ci) Sanger sequencing chromatogram of wild-type (WT) whole-embryo DNA (upper panel; non-edited control) compared to that from F3 embryos injected with synthetic lbr gRNA complexed to exogenous Cas9 protein (middle panel; positive control) and neutrophil-lineage gene editing in fluorescence-activated cell sorting (FACS)-purified neutrophils from Tg(mpx-Cas9) embryos injected with synthetic lbr gRNA (lower panel). (Cii) Manhattan plot from next-generation sequencing (NGS) of the same neutrophil DNA preparation as Ci (lower panel), displaying cumulative distribution of aligned deleted alleles at the target locus. (Ciii) NGS of the same DNA preparation as Ci (lower panel) revealed six predominant variants (Var 1-6, bracketed Var 2 and 3 occurred in cis), representing 62.75% on-target gene editing. None of these variants was seen in DNA from embryos not injected with lbr gRNA. (Civ) Predicted amino acid sequences of variants 1-6. A high proportion of gene edits (70.28%), representing 44.1% of the NGS reads, are predicted to be nonsense mutations. (D) Low-level on-target lbr gene editing from plasmid gRNA delivery using a plasmid encoding lbr gRNA expressed from the U6 promoter (plasmid gRNA). (Di) Upper panel shows Sanger sequencing chromatogram of DNA from whole 3 dpf embryos injected with 1.5 ng/µl plasmid gRNA and exogenous Cas9 enzyme, serving as a positive control, showing low-level gene editing from plasmid gRNA delivery when Cas9 is in abundance. Lower panel shows Sanger sequencing chromatogram of DNA from FACS-purified neutrophils of 5 dpf Tg(mpx-Cas9) embryos injected with 30 ng/µl lbr plasmid gRNA alone, showing no detectable gene editing. (Dii) NGS of the same neutrophil DNA preparation as in Di (lower panel) detected one gene-edited variant (Var 1), representing 1.45% on-target gene editing. No gene editing was detected by NGS in ‘other cells’ from these same embryos. This variant was not seen in DNA from embryos not injected with lbr plasmid gRNA. (Diii) Predicted amino acid sequence of variant 1 results in a nonsense mutation. (E) No gene editing was detected by Sanger sequencing in FACS-purified macrophages from 3 dpf Tg(mpeg1:Cas9) embryos (right panel). FACS-purified neutrophils serve as an internal negative control (left panel). PAM, protospacer adjacent motif highlighted in red boxes and red font; red arrows indicate the sequencing direction; red asterisks mark sequence heterogeneity due to on-target gene editing; red dots indicate deletion; blue font, substituted nucleotides; green font, inserted nucleotides; purple font, truncated protein; black dots, sequence continues as WT.

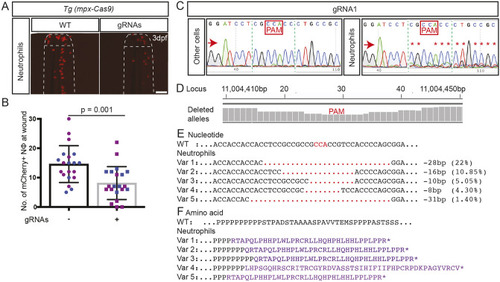
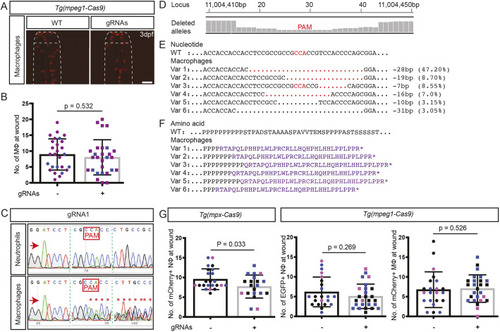
(A) Zebrafish trim33 locus showing target sites for two gRNAs in exon 1 and 15. (B) Sanger chromatogram of WT whole-embryo DNA (upper row) compared to F0 Tg(mpeg1:Gal4FF/UAS:NTR-mCherry)(mpx:GFP) crispant embryos injected with two multiplexed trim33 gRNAs complexed to exogenous Cas9 protein (lower row). (C) Fluorescent images of GFP-labelled neutrophils and mCherry-labelled macrophages at 3.5 h after caudal fin transection, in WT and trim33 crispant 3 dpf Tg(mpeg1:Gal4FF/UAS:NTR-mCherry)(mpx:GFP) embryos. Embryos from the same experiment as in B. (D) Neutrophil and macrophage numbers at wound site at 3.5 h post-injury. Red arrows indicate the sequencing direction; red asterisks indicate sequence heterogeneity due to on-target gene editing; green vertical dashed lines indicate cropped areas of the chromatogram; PAM, protospacer adjacent motif highlighted in red boxes. Unpaired two-tailed Student’s t-test (P<0.0001) of pooled data from two independent experiments indicated by different colours. Scale bars: 100 µm.

Neutrophils and macrophages from whole-body trim33 crispants have on-target gene editing. (A) Sanger chromatograms of DNA from FACS-purified neutrophils and macrophages from whole-body 3.5 dpf Tg(mpeg1:Gal4FF/UAS:NTR-mCherry)(mpx:GFP) crispant embryos injected with trim33 gRNA1 complexed with Cas9, demonstrating on-target gene editing in both leukocyte types. (B) Manhattan plots from NGS of the same DNA preparation as in A, displaying cumulative distribution of aligned deleted alleles at the target locus in neutrophils and macrophages. (C) There is a single allele in WT and eight predominant variants (Var 1-8), representing on-target gene-editing rates of 26.65% in neutrophils and 29.35% in macrophages. (D) Predicted amino acid sequences of variants 1-8; all are predicted to be nonsense mutations. Red arrows indicate the sequencing direction; red asterisks mark sequence heterogeneity; PAM, protospacer adjacent motif highlighted in red boxes and font; red dots, deletion; green font, insertion; purple font, truncated protein; black dots, sequence continues as WT.

Effects of trim33 knockdown on neutrophil migration in Tg(mpx-cas9) zebrafish embryos. (A) Representative fluorescent images of mCherry-labelled neutrophil at caudal fin 3.5 h post-wounding in 3 dpf Tg(mpx-Cas9) embryos injected with two trim33 gRNAs, compared to uninjected transgenic embryos (WT), demonstrating the impaired migratory neutrophil response to caudal fin injury in gRNA-microinjected crispant embryos compared to WT. (B) Quantification of neutrophil response. (C) Sanger sequencing chromatogram of independent experiment demonstrating on-target Cas9 activity in FACS-purified mCherry-positive neutrophils. (D) Manhattan plots from NGS of the same neutrophil DNA preparation as in C, displaying cumulative distribution of aligned deleted alleles at the target locus. (E) WT reference sequence compared to five predominant variants (Var 1-5), representing 43.6% on-target gene editing in neutrophils. (F) Predicted amino acid sequences of variants 1-5 with nonsense mutations. Red arrows indicate the sequencing direction; red asterisks mark sequence heterogeneity; green vertical dashed lines indicate cropped areas of the chromatogram; PAM, protospacer adjacent motif highlighted in red boxes and font; red dots, deletion; purple font, truncated protein; black dots, sequence continues as WT. Unpaired two-tailed Student’s t-test (P=0.001) of pooled data from two independent experiments indicated by different colours. Scale bar: 100 µm.

On-target trim33 gene editing in macrophages of Tg(mpeg1-Cas9) zebrafish embryos. (A) Representative fluorescent images of mCherry-labelled macrophage at caudal fin 3.5 h post-wounding in 3 dpf Tg(mpeg1-Cas9) injected with two trim33 gRNAs, compared to uninjected transgenic embryos (WT). (B) Quantification of macrophage migratory response. (C) Sanger sequencing chromatogram of an independent experiment, demonstrating on-target Cas9 activity in FACS-purified mCherry-positive macrophages. (D) Manhattan plots from NGS of the same DNA preparation as in C, displaying cumulative distribution of aligned deleted alleles at the target locus in macrophages. (E) WT reference sequence compared to six predominant variants (Var 1-6), representing 77.65% on-target gene editing in macrophages. (F) Predicted amino acid sequences of variants 1-6 with nonsense mutations. (G) Quantification of neutrophils at wound site in concurrent groups of Tg(mpx-Cas9) and Tg(mpeg1-Cas9) embryos injected with the same trim33 gRNAs, showing a neutrophil migratory defect in Tg(mpx-Cas9) neutrophils but not in Tg(mpeg1-Cas9) neutrophils. The absence of a migration defect in trim33 knockdown Tg(mpeg1-Cas9) macrophages (B) is replicated. Red arrows indicate the sequencing direction; red asterisks mark sequence heterogeneity; green vertical dashed lines indicate cropped areas of the chromatogram; PAM, protospacer adjacent motif highlighted in red boxes and font; red dots, deletion, purple font, truncated protein; black dots, sequence continues as WT. Unpaired two-tailed Student's t-test (P=0.53) of pooled data from two (B) and three (G) independent experiments indicated by different colours. Scale bar: 100 µm.

Acknowledgments
This image is the copyrighted work of the attributed author or publisher, and ZFIN has permission only to display this image to its users. Additional permissions should be obtained from the applicable author or publisher of the image. Full text @ Dis. Model. Mech.