
- Title
-
Diet and temperature modify the relationship between energy use and ATP production to influence behavior in zebrafish (Danio rerio)
- Authors
- Le Roy, A., Mazué, G.P.F., Metcalfe, N.B., Seebacher, F.
- Source
- Full text @ Ecol Evol
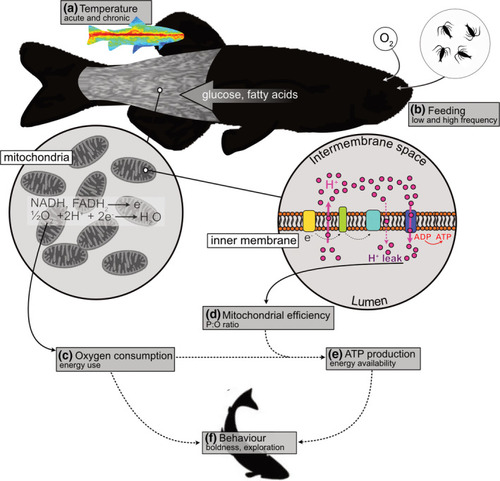
Conceptual outline of the study. Food availability does not necessarily indicate energy available for cellular work, at least partly because of variation in mitochondrial efficiency. We tested whether different acute and acclimation temperatures (a) interact with food availability (b) to alter energy transduction efficiency and thereby influence behavior. Food is broken down into macronutrients, and glucose and fatty acids are principally responsible to yield substrates (NADH and FADH2) oxidized in muscle mitochondria. Whole‐animal oxygen consumption (c) is therefore a measure of the energy used in the mitochondrial electron transport chain. However, the efficiency of mitochondria (d) in converting the energy released by substrate oxidation into ATP (P:O ratio) can vary with environmental conditions. To estimate the amount of ATP produced, we corrected oxygen consumption for mitochondrial efficiency (e). This procedure permitted us to test the relative importance of increased energy use or increased ATP availability in influencing behavior (f), for example, by stimulating or reducing foraging, respectively. Note that the broken arrows indicate connections between experimental measures rather than biological cause‐and‐effect relationships |
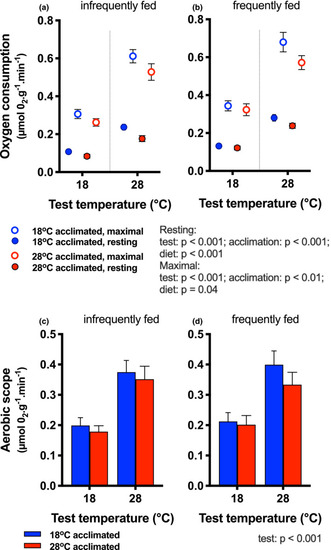
Whole‐animal oxygen consumption. Resting (filled circles) and maximal (open circles) oxygen consumption rates are shown for fish infrequently (a) and frequently fed (b). Test temperature, acclimation temperature, and diet each had main effects on resting and maximal rates (blue symbols = 18°C acclimation; red symbols = 28°C acclimation) for resting rates. Aerobic scope [(c) infrequently fed, (d) frequently fed] was higher at 28°C test temperature than at 18°C, and none of the other factors (blue bars = cold‐acclimated; red bars = warm‐acclimated) had a significant effect. Statistical results are summarized next to the legend. Means ± |
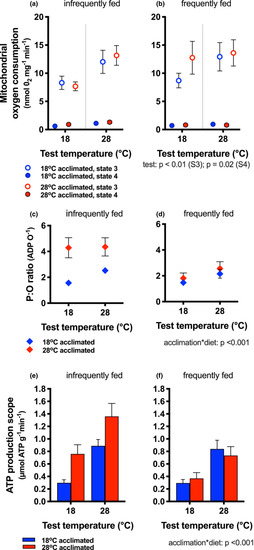
Mitochondrial bioenergetics and scope for ATP production. State 3 (open circles) and state 4 (filled circles) rates of mitochondrial oxygen consumption in fish fed infrequently (a) and frequently (b) and acclimated to 18°C (blue symbols) and 28°C (red symbols). Rates of oxygen consumption increased with increasing test temperature (main effect, indicated next to legend), but diet and acclimation temperature had no effect on state 3 or state 4 rates. P:O ratios (ATP produced for each oxygen consumed) increased with acclimation temperature and diet, but was highest in 28°C acclimated animals (red bars) that were fed infrequently compared to cold‐acclimated fish (blue bars) and those fed frequently (diet*acclimation interaction; indicated next to legend). ATP production scope increased with increasing test temperature [(e) infrequently fed, (f) frequently fed], and it increased particularly in warm‐acclimated fish that were infrequently fed (acclimation* diet interaction). Means ± |
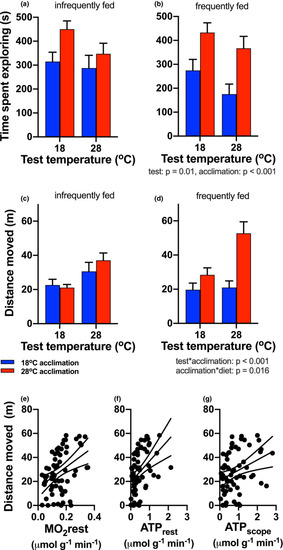
Exploration behavior. The time spent exploring in the arena (a, b) decreased with increasing test temperature (test temperature main effect), and warm‐acclimated fish (red bars) spent more time exploring than cold‐acclimated fish (blue bars; main effect of acclimation). The total distance traveled by fish in the arena (c, d) was determined by significant interactions between test and acclimation temperature, and between acclimation temperature and diet. Statistical results are summarized below the right panels of each behavioral response. Distance moved increased linearly with resting oxygen consumption (MO2rest) (e), resting ATP production (ATPrest) (f), and ATP production scope (ATPscope) (g). Significant regression lines (±95% CI) are shown (MO2rest: Y = 14.66 + 86.55x, |