
|
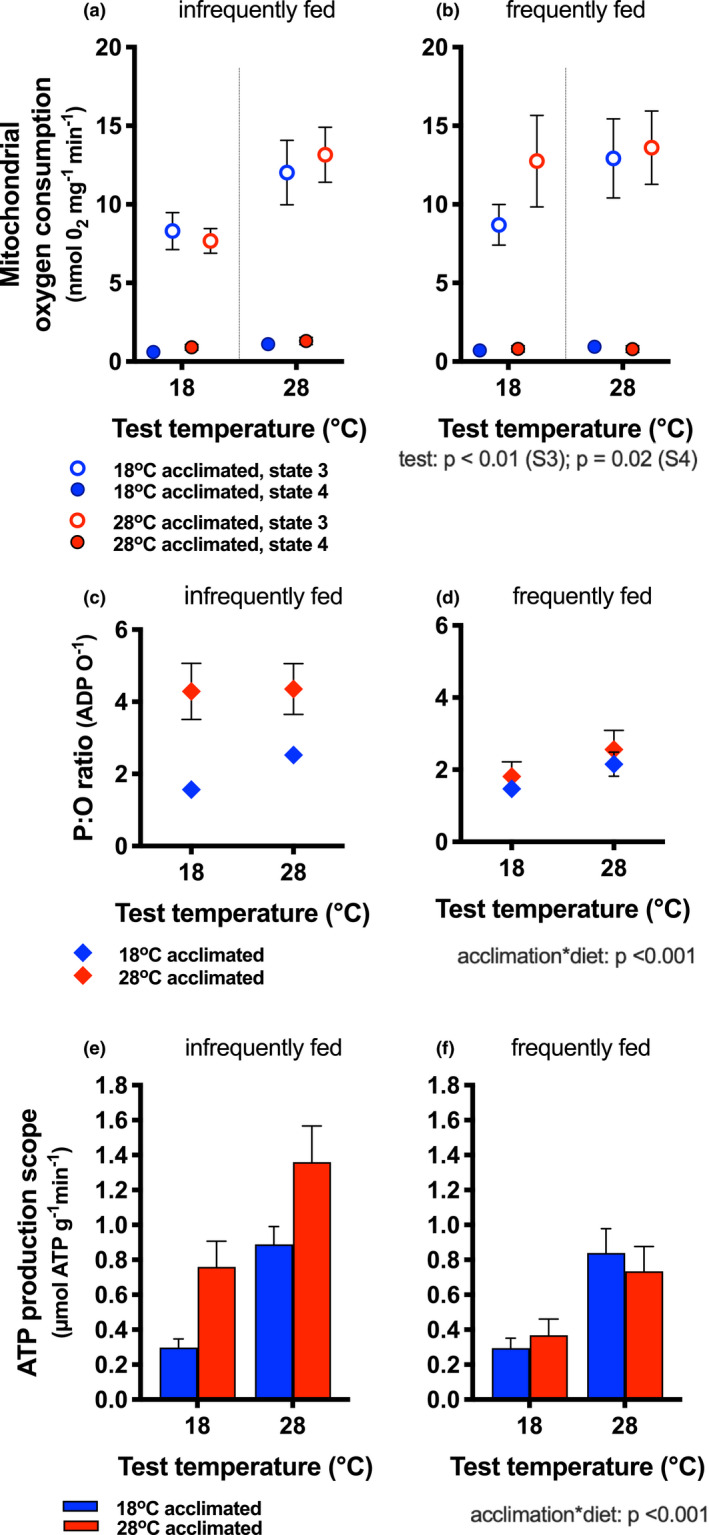
FIGURE 3
Mitochondrial bioenergetics and scope for ATP production. State 3 (open circles) and state 4 (filled circles) rates of mitochondrial oxygen consumption in fish fed infrequently (a) and frequently (b) and acclimated to 18°C (blue symbols) and 28°C (red symbols). Rates of oxygen consumption increased with increasing test temperature (main effect, indicated next to legend), but diet and acclimation temperature had no effect on state 3 or state 4 rates. P:O ratios (ATP produced for each oxygen consumed) increased with acclimation temperature and diet, but was highest in 28°C acclimated animals (red bars) that were fed infrequently compared to cold‐acclimated fish (blue bars) and those fed frequently (diet*acclimation interaction; indicated next to legend). ATP production scope increased with increasing test temperature [(e) infrequently fed, (f) frequently fed], and it increased particularly in warm‐acclimated fish that were infrequently fed (acclimation* diet interaction). Means ±