
|
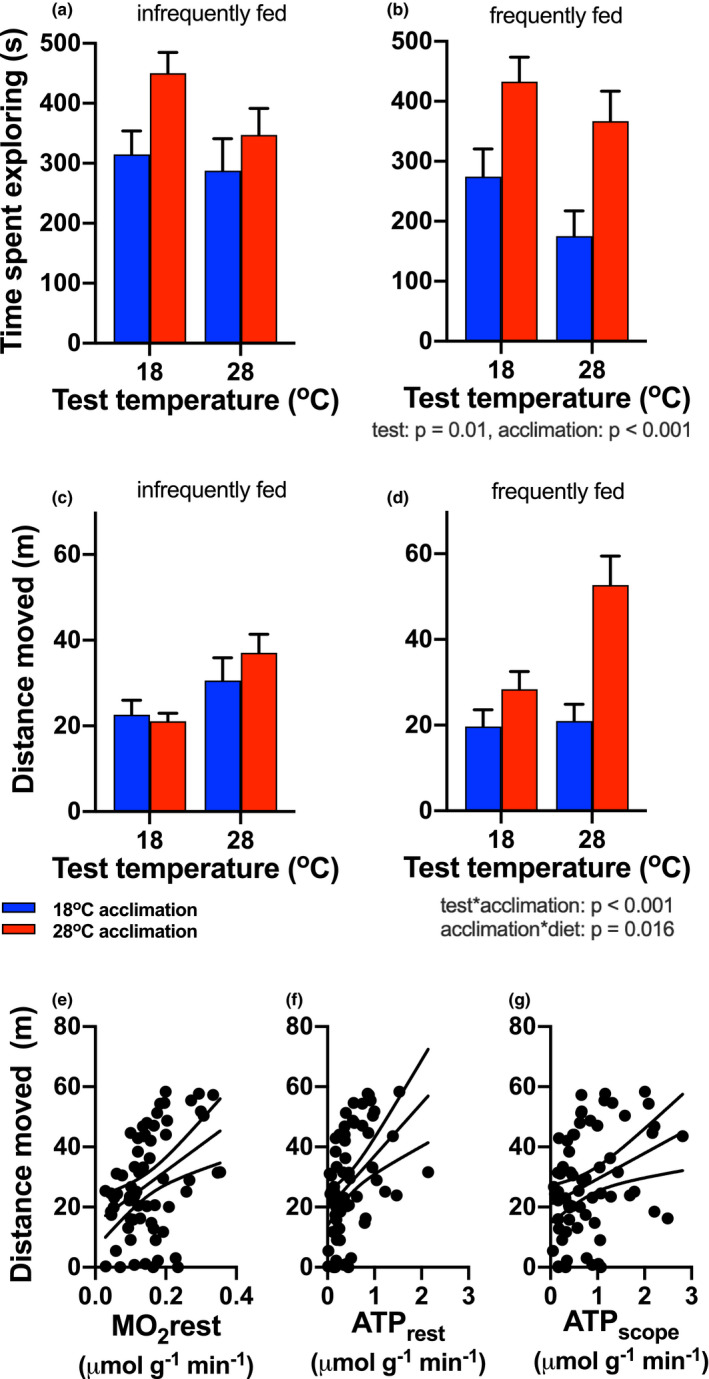
FIGURE 4
Exploration behavior. The time spent exploring in the arena (a, b) decreased with increasing test temperature (test temperature main effect), and warm‐acclimated fish (red bars) spent more time exploring than cold‐acclimated fish (blue bars; main effect of acclimation). The total distance traveled by fish in the arena (c, d) was determined by significant interactions between test and acclimation temperature, and between acclimation temperature and diet. Statistical results are summarized below the right panels of each behavioral response. Distance moved increased linearly with resting oxygen consumption (MO2rest) (e), resting ATP production (ATPrest) (f), and ATP production scope (ATPscope) (g). Significant regression lines (±95% CI) are shown (MO2rest: Y = 14.66 + 86.55x,