
|
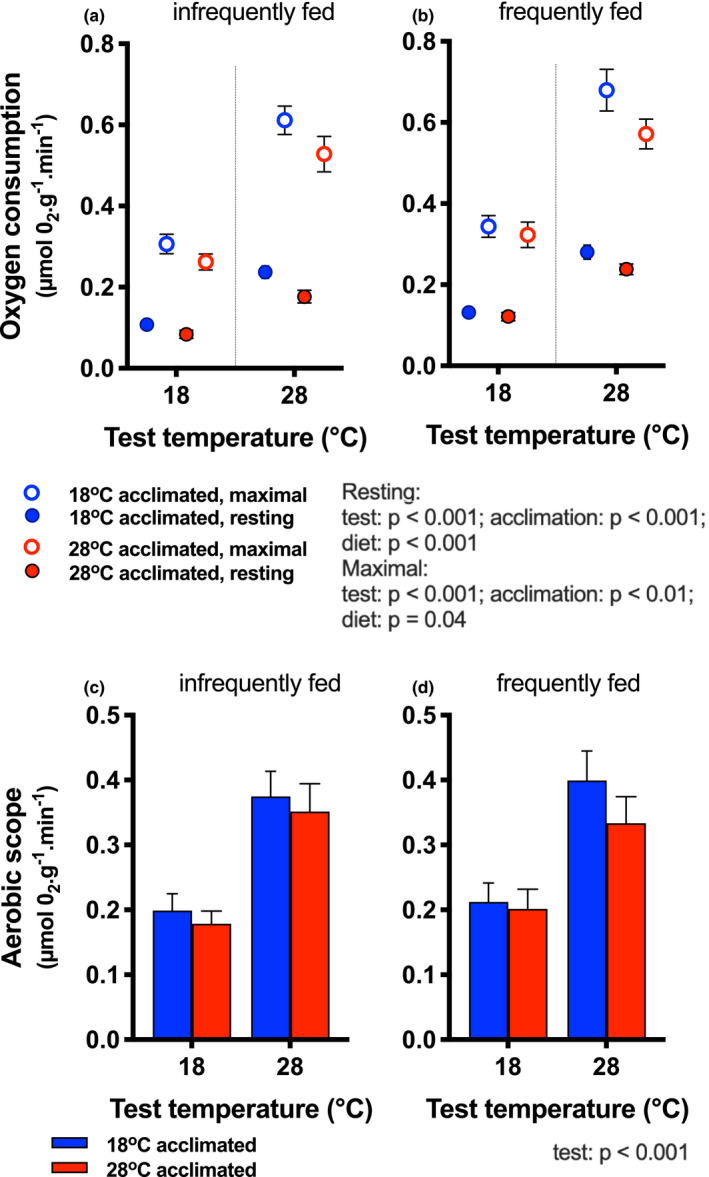
FIGURE 2
Whole‐animal oxygen consumption. Resting (filled circles) and maximal (open circles) oxygen consumption rates are shown for fish infrequently (a) and frequently fed (b). Test temperature, acclimation temperature, and diet each had main effects on resting and maximal rates (blue symbols = 18°C acclimation; red symbols = 28°C acclimation) for resting rates. Aerobic scope [(c) infrequently fed, (d) frequently fed] was higher at 28°C test temperature than at 18°C, and none of the other factors (blue bars = cold‐acclimated; red bars = warm‐acclimated) had a significant effect. Statistical results are summarized next to the legend. Means ±