FIGURE SUMMARY
Title

Impairing flow-mediated endothelial remodeling reduces extravasation of tumor cells

Authors
Follain, G., Osmani, N., Gensbittel, V., Asokan, N., Larnicol, A., Mercier, L., Garcia-Leon, M.J., Busnelli, I., Pichot, A., Paul, N., Carapito, R., Bahram, S., Lefebvre, O., Goetz, J.G.
Source
Full text @ Sci. Rep.

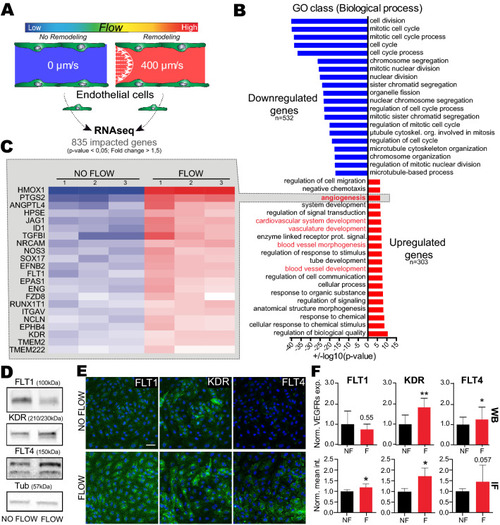
Flow favors expression of gene program driving vasculature remodeling, including VEGFRs. (A) Experimental setup: microfluidic experiment for RNA sequencing. (B) Results from global Gene Ontology (GO) analysis on ‘biological process’, showing most significantly impacted GO class. (C) Fold changes heatmap, based on GO class: Angiogenesis, showing significantly upregulated genes in flow condition compared to no flow. (D) Western blot quantification validating some of VEGFR RNAseq data. (E) Representative image of flow vs no flow immunofluorescence labelling of FLT1, KDR and FLT4 (green) with DAPI (blue). (F) Quantification associated with D and E, showing increased expression and signal intensity of VEGFRs. WB: N = 5, Mann Whitney test, IF: N = 4 with min 5 fields/exp, Mann Whitney test.

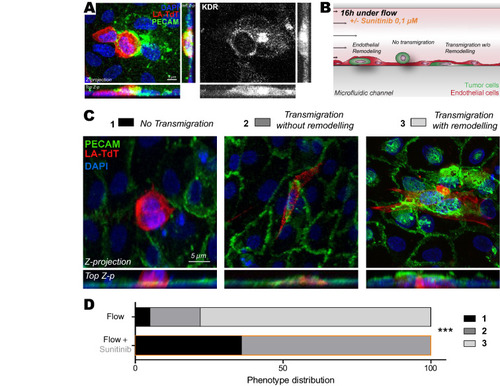
Inhibition of VEGFRs with sunitinib impairs endothelial remodeling in vitro. (A) Immuno-labelling pictures showing the presence of KDR (white) at the site of endothelial remodeling (Assessed with PECAM enrichment (green) around tumor cell (red)). Z-projections and two z-projection from side and top view are shown. (B) Experimental setup: microfluidic channel for endothelial remodeling assay. (C) Representative images of all steps: 1-No transmigration, 2-Transmigration without remodeling evidence, 3-Transmigration with remodeling. Quantification of the normalized number of transmigrating cells and remodeling activity. (D) Phenotypic distribution of CTCs attached to endothelial layers exposed to flow and treated with vehicle or sunitinib. N: flow/vehicle = 88, flow/sunitinib = 150, Fischer test.

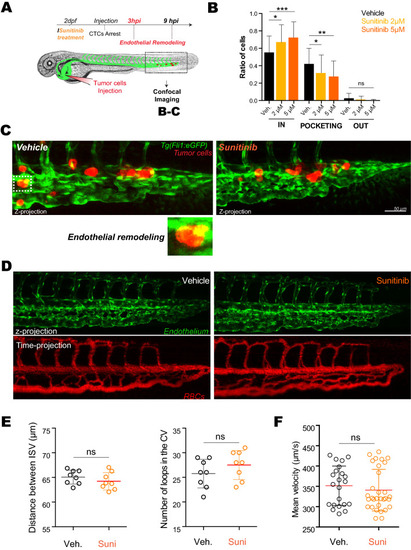
Inhibition of VEGFRs with sunitinib reduces endothelial remodeling in zebrafish embryos. (A) Experimental setup used: zebrafish are imaged at 3 hpi (hours post-injection). (B) Quantification of intravascular, remodeling and extravasated cells 3hpi. N cells: vehicle = 622, sunitinib 2 µM = 375, sunitinib 5 µM = 254. N embryos : vehicle = 62, sunitinib 2 µM = 34, sunitinib 5 µM = 27, Kruskal–Wallis test followed by Dunn's multiple Comparison test. (C) Representative image of arrested D2A1 cells in the caudal plexus of vehicle or sunitinib treated embryos. Vehicle: DMSO. (D) Representative confocal image of the caudal plexus architecture (upper panel) and blood flow (lower panel, RBC = red blood cells) 3 h post-treatment with sunitinib vs vehicle in Tg(fli1a:EGFP;gata1:DsRed). (E) Quantification of the effect of sunitinib on vessel architecture after 3 h of treatment with vehicle or 5 µM of sunitinib, N = 8, Student t test. (F) Blood flow perfusion profiles of the same embryos (from D) and quantification of the blood flow velocity in the caudal plexus of embryos in both conditions after 3 h of treatment with vehicle or 5 µM of sunitinib. N embryos: vehicle = 8, sunitinib 5 µM = 10. Mann Whitney test.

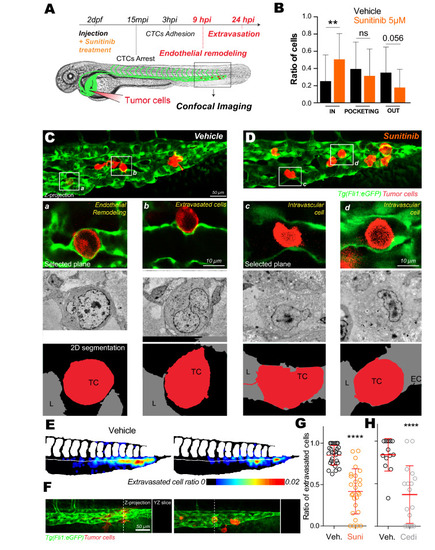
Inhibition of VEGFRs with sunitinib impacts extravasation by endothelial remodeling. (A) Experimental setup used: zebrafish are imaged at 9 hpi & 24 hpi. (B) Quantification of intravascular, remodeling and extravasated cells 9 hpi. N cells: vehicle = 134, sunitinib = 155. N embryos: vehicle = 23, sunitinib = 25, Kruskal–Wallis test followed by Dunn's multiple Comparison test. (C,D) Representative image of the caudal plexus by confocal intravital imaging (upper panel), corresponding correlative light and electron microscopy imaging (middle panel) and reconstructed segmented images (lower panel). In vehicle treated embryos, tumor cells of interest are a and b (white squares on (C)). In sunitinib treated embryos, tumor cells of interest are c and d (white squares on (D)). TC tumor cell, EC endothelial cell, L lumen. (E) The heatmaps show the quantification and location of extravascular CTCs at 24 hpi in the caudal plexus treated with vehicle or 2 µM of sunitinib. (F) Representative images and orthoslice at 24 hpi. (G) Quantification of extravasated cells ratio at 24 hpi treated with vehicle or 2 µM of sunitinib. N cells: vehicle = 588, sunitinib = 441. N embryos: vehicle = 27, sunitinib = 27, Mann Whitney test. (H) Quantification of extravasated cells ratio at 24 hpi treated with vehicle or 0.1 µM of cediranib. N cells: vehicle = 134, cediranib = 143. N embryos: vehicle = 13, cediranib = 17, Mann Whitney test.

Acknowledgments
This image is the copyrighted work of the attributed author or publisher, and ZFIN has permission only to display this image to its users. Additional permissions should be obtained from the applicable author or publisher of the image. Full text @ Sci. Rep.