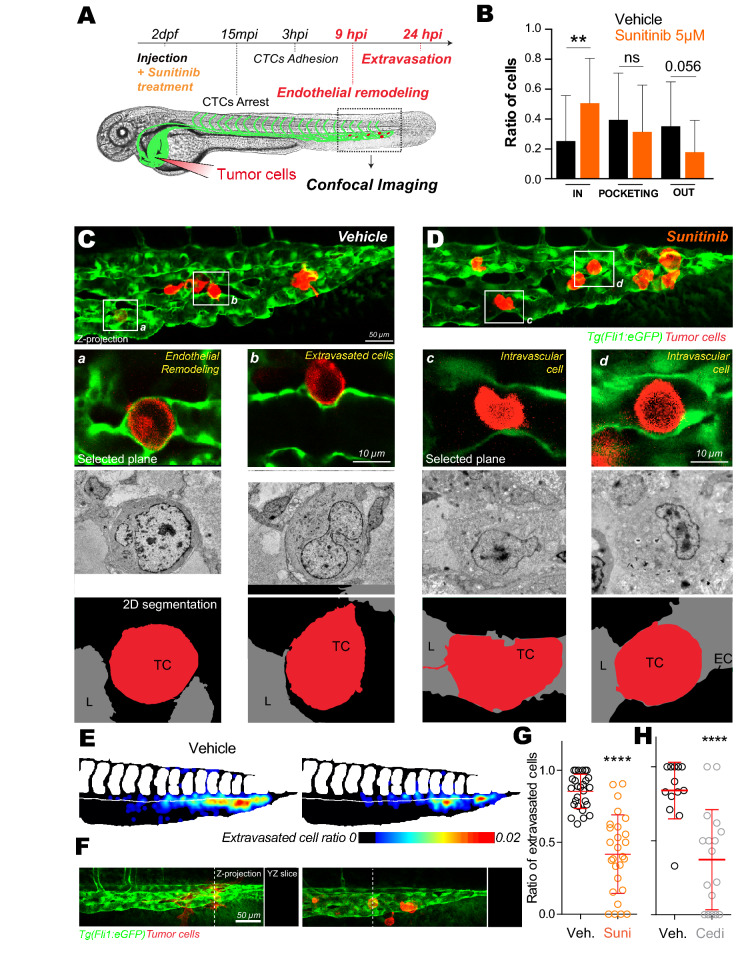
Inhibition of VEGFRs with sunitinib impacts extravasation by endothelial remodeling. (A) Experimental setup used: zebrafish are imaged at 9 hpi & 24 hpi. (B) Quantification of intravascular, remodeling and extravasated cells 9 hpi. N cells: vehicle = 134, sunitinib = 155. N embryos: vehicle = 23, sunitinib = 25, Kruskal–Wallis test followed by Dunn's multiple Comparison test. (C,D) Representative image of the caudal plexus by confocal intravital imaging (upper panel), corresponding correlative light and electron microscopy imaging (middle panel) and reconstructed segmented images (lower panel). In vehicle treated embryos, tumor cells of interest are a and b (white squares on (C)). In sunitinib treated embryos, tumor cells of interest are c and d (white squares on (D)). TC tumor cell, EC endothelial cell, L lumen. (E) The heatmaps show the quantification and location of extravascular CTCs at 24 hpi in the caudal plexus treated with vehicle or 2 µM of sunitinib. (F) Representative images and orthoslice at 24 hpi. (G) Quantification of extravasated cells ratio at 24 hpi treated with vehicle or 2 µM of sunitinib. N cells: vehicle = 588, sunitinib = 441. N embryos: vehicle = 27, sunitinib = 27, Mann Whitney test. (H) Quantification of extravasated cells ratio at 24 hpi treated with vehicle or 0.1 µM of cediranib. N cells: vehicle = 134, cediranib = 143. N embryos: vehicle = 13, cediranib = 17, Mann Whitney test.
Acknowledgments
This image is the copyrighted work of the attributed author or publisher, and
ZFIN has permission only to display this image to its users.
Additional permissions should be obtained from the applicable author or publisher of the image.
Full text @ Sci. Rep.
Your Input Welcome
Thank you for submitting comments. Your input has been emailed to ZFIN curators who may contact you if
additional information is required.
Oops. Something went wrong. Please try again later.